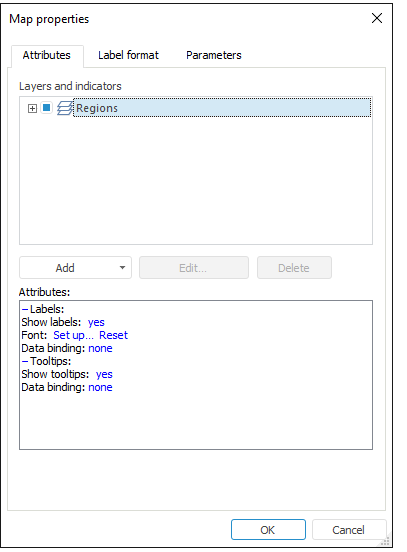
Map layer is set up on the Attributes tab in the Map Properties dialog box.

Select the required layer in the Layers and Indicators list and set the following parameters in the Attributes area:
Labels. Determine parameters of displaying layer name on the map:
Show Labels. Select the Yes value to show label for the selected layer. If the No value is selected, labels are not shown.
Font. Click the Set Up hyperlink to determine label font options. The Font dialog box opens. To restore the default value, click the Reset hyperlink.
Data Binding. Click the No hyperlink to determine name and other parameters of the slice to be used as a base for labels creation. The Data Adapter dialog box opens.
Text. Click the Set Up hyperlink to determine label text. In the Formula Editor dialog box set formula to create a label.
NOTE. The attribute appears only after data binding is set.
Tooltips. It is shown only for the layers with the MouseTransparent property set to False, that is, they are not transparent. Define the following parameters of displaying tooltips on the map:
Show Tooltips. Select the Yes value to show tooltip for the selected layer. If the No value is selected, tooltips are not displayed.
Data Binding. Click the No hyperlink to determine name and other parameters of the slice to be used as a base for tooltips creation. The Data Adapter dialog box opens.
Text. Click the Set Up hyperlink to determine tooltip text. In the Formula Editor dialog box set formula to create a tooltip.
NOTE. The attribute appears only after data binding is set.
See also:
Getting Started with the Reports Tool in the Web Application | Setting Up Indicators