In Foresight Analytics Platform desktop application the user can set up various table formatting: formatting styles, manual formatting for areas, conditional formatting. If there are several formatting settings, they are applied in a certain order.
Data formatting is set for:
Data table of express report.
Data table of dashboard.
table visualizer of regular report.
In the data formatting order, each next item overlaps the previous one:
Data distribution. It overlaps only cell fill.
Metrics : color, font color, font size.
Conditional formatting. It overlaps only cell fill.
In manual formatting and conditional formatting format can be set for different table elements, in this case the order of applying of format is the following:
Entire table. The lowest priority.
Data.
Row dimension.
Level of row dimension.
Single row.
Column dimension.
Level of column dimension.
Single column.
Totals by columns.
Totals by rows. The highest priority.
NOTE. When several rows or column dimensions are selected, format of the last selected dimension is used.
Manual fill setup of row dimension will be overlapped by single column fill, but conditional formatting configured for the row will overlap any manually configured fill.
When working with tables in regular reports, the main formatting is formatting of data and totals.
When formatting the table, data area formatting, formula area formatting, totals formatting and formatting of calculated indicators can be overlapped by other styles but on clicking the Update button the formatting is set up according to the data area parameters.
Special borders formatting is set for:
Data table of express report.
Data table of dashboard.
table visualizer of regular report.
When special borders are applied, each next item overlaps the previous one:
Table. Lowest priority. To set up table borders select the entire table, go to the Table side panel tab and then to the Formatting tab. Select the Special Border checkbox and determine special border settings.
Corner. To set up corner borders, select the corner, go to the Corner side panel tab and then to the Formatting tab. Select the Special Border checkbox and determine special border settings.
Data. To set up data borders, select data, go to the Data side panel tab and then to the Formatting tab. Select the Special Border checkbox and determine special border settings.
The example of overlapping corner borders with data borders:
The example displays green borders configured for the corner and blue borders configured for the data. At the intersection of the lower left corner and the upper right corner the blue border overlaps the green one.
Sidehead. To set up sidehead borders, select the sidehead, go to the Header side panel tab and then to the Formatting tab. Select the Special Border checkbox and determine special border settings.
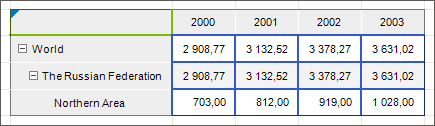
The example of overlapping data borders with sidehead borders:
The example displays green borders configured for the sidehead and blue borders configured for the data. At the intersection of the sidehead's right border and the data left border the sidehead's green border overlaps the blue one.
The example of overlapping corner borders with sidehead borders:
The example displays blue borders configured for the sidehead and green borders configured for the corner. At the intersection of the sidehead's top border and the corner's bottom border the sidehead's blue border overlaps the green one.
Heading. To set up heading borders, select the heading, go to the Header side panel tab and then to the Formatting tab. Select the Special Border checkbox and determine special border settings.
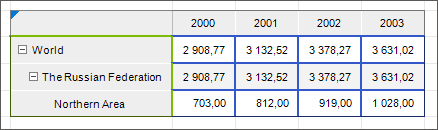
The example of overlapping sidehead borders with heading borders:
The example displays green borders configured for the sidehead and blue borders configured for the heading. At the intersection of the upper right corner of the sidehead and the lower left corner of the heading the blue border overlaps the green one.
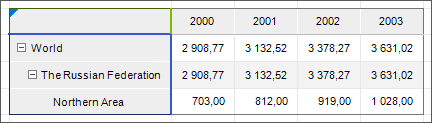
The example of overlapping corner borders with heading borders:
The example displays green borders configured for the corner and blue borders configured for the heading. At the intersection of the corner's right border and the heading's left border the blue border overlaps the green one.
Dimension borders. To set up dimension style, select the dimension, go to the Dimension side pane tab, then to the Header Formatting tab if it is required to set up dimension header borders, or to the Data Formatting tab if it is required to set up dimension data borders. Select the Special Border checkbox and determine special border settings.
Dimension level borders. To set up dimension level style, select the level, go to the Level side panel tab, then to the Header Formatting tab if it is required to set up level header borders, or to the Data Formatting tab if it is required to set up level data borders. Select the Special Border checkbox and determine special border settings.
Dimension element borders. To set up dimension element style, select the required dimension element in the sidehead or heading, go to the Format side panel tab, then to the Header Formatting tab if it is required to set up element header borders, or to the Data Formatting tab if it is required to set up element data borders. Select the Special Border checkbox and determine special border settings.
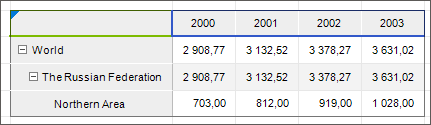
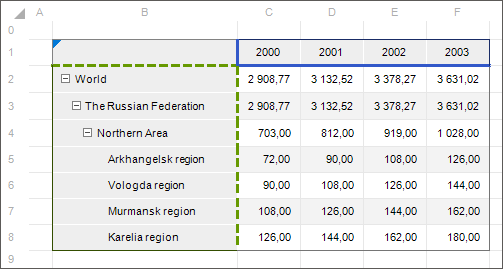
The example of overlapping dimension level borders with dimension element borders:
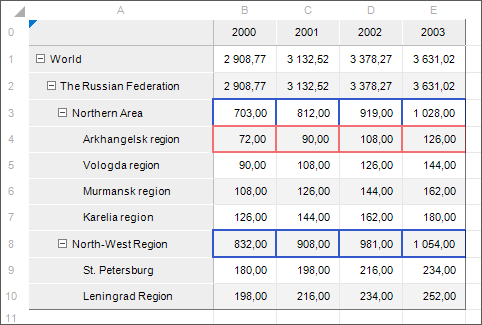
The example displays special data borders configured for the Arkhangelsk Region dimension element and for the FD Territories dimension level. The element border has the pink border, the level has the blue border. The upper border of the dimension element overlaps the lower border of the dimension level.
NOTE. When vertical and horizontal borders are intersected, heading dimension elements (vertical borders) have the highest priority. The cell located at the intersection of borders may not display intersecting borders. To display intersecting borders, use the IEaxGridViewSettings.ShowRealBorderDataStyle property.
Conditional data formatting borders. Conditional formatting is applied to data dynamically, styles are not stored in cells.
Changed data borders. Changed data formatting is applied dynamically, styles are not stored in cells.
Borders specified with control block. One can use control blocks to set up checking of entered data entered to data entry forms and formatting of values that did not pass check. The formatting that is set up in a control block is applied to data dynamically, styles are not stored in cells.
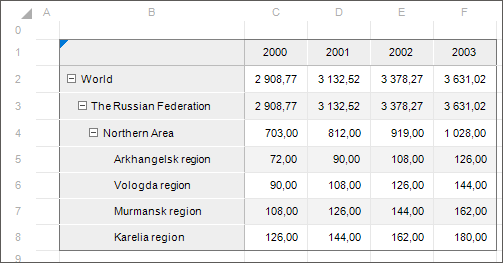
Outer table borders. By default, outer table borders are displayed on a report sheet, outer border line type and color are set by default:
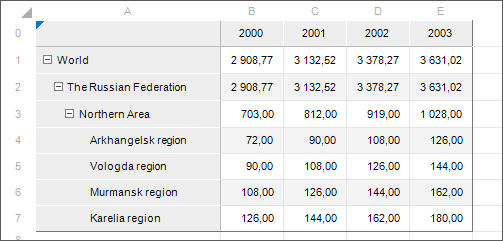
If the upper left table cell is located in the A0 cell, the top and left outer table borders are not displayed:
Outer table border line type and color can be changed via regions setup using the ITabRegion interface.
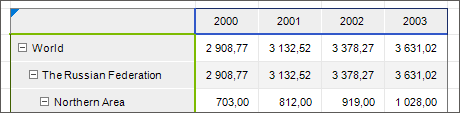
The example of overlapping table sidehead and heading borders with outer border:
The example displays the top, left, right, and bottom special borders configured for the sidehead and the heading. The sidehead has the green borders, the heading has the blue borders. The outer border overlaps the left and the bottom borders of the sidehead, and the top and the right borders of the heading.
Region borders. Highest priority. To work with table regions, use the ITabRegion interface.
See also: