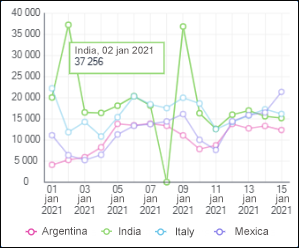
Tooltips display necessary information about data series point, level line, or data series in legend on mouseover on the corresponding chart element.
To set up tooltip parameters, use the Tooltips group of parameters on the side panel.

 Open the Tooltips group of parameters
To open the Tooltips group of parameters:
Select a chart.
Press the  Settings button on the toolbar. The side panel is hidden by default.
Select the required group of parameters.
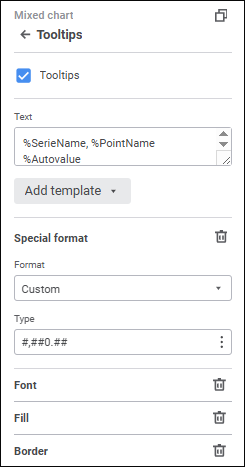
Select the Tooltips checkbox to show tooltips on the chart and set the parameters:
A custom text, template or a combination of both can be set for tooltips. To enter text and templates, use the Text box.
To add a template to the label text:
Click the Add Template button.
In the drop-down list select one of the available text templates.
After executing the operations the selected template will be added to label text after the cursor.
Available templates:
%PointNo. Point number.
%PointName. Point name.
%SerieNo. Series number.
%SerieName. Series name.
%PercentPartHundredth. Cumulative shares.
%PercentPart. Percentage cumulative shares.
%PercentHundredth. Shares are the ratio of the point value to the sum of values of this point over all the series.
%Percent. Percent shares are ratio of the series point value to sum of values for this point in all series, shown as a percentage.
%Part. Cumulative value.
%YValue. Y axis point value.
%XValue. X axis point value.
%Value. Point value.
%Autovalue. Default value. Automatic value format.
NOTE. Tooltip text is determined automatically for level lines.
To change data format settings, select one of the supported data formats in the drop-down list. The different settings are available depending on the selected format:
General. Equal to canceling formatting.
Number. When the Number format is selected, the following settings are available:
Decimal Places. Select the number of displayed decimal places.
Negative Numbers. Select the format of displaying negative numbers.
Thousands Separator. Select the checkbox to apply the thousands separator option. The checkbox is deselected by default.
Percentage. When the Percentage format is selected, the Decimal Places setting is available. Select the number of displayed decimal places.
When the Percentage format is used, number values are multiplied by 100 and the "%" character is added. Values entered into a cell are processed in different ways depending on the way the % character is used. For example, when 40% is entered, the cell displays 40%, but the cell value is 0.4. When 40 is entered, the cell displays 4000%, but the cell value is 40.
Currency. When the Currency format is selected, the following settings are available:
Decimal Places. It sets the number of displayed decimal places.
Symbol. It sets currency symbol.
Negative Numbers. Select the format of displaying negative numbers.
Date. When the Date format is selected, the Type setting is available. Select date display format in the drop-down list.
Time. When the Time format is selected, the Type setting is available. Select time display format in the drop-down list.
Exponential. This format is used to show a number in exponential format. When the Exponential format is selected, the Decimal Places setting is available. Select the number of displayed decimal places.
Text. Equal to canceling formatting.
Additional. When the Additional format is selected, the Type setting is available. To automatically convert value, select the preset option:
Zip code.
Telephone number.
Table number.
Custom. It contains code views of all available data formats. When the Custom format is selected, the Type setting is available. To automatically convert value, select the preset option.
Examples of number templates:
Format |
Initial value |
Displayed value |
| # | 5 | 5 |
| 00 | 5 | 05 |
| #,# | 10 1000 |
10 1 000 |
| #.0# | 12 12,557 |
12,0 12,56 |
| #,#.000 | 150 | 150,000 |
| #, | 10000 | 10 |
| #,.00 | 100 | 0,10 |
| #.0E+00 | 1000 | 1,0E+003 |
To reset the settings and restore the default style, click the  Delete button.
NOTE. If data format settings were determined for the fields that are used in plotting a chart, these settings will be displayed in the Special Format group of settings.
Determine font settings:
Font. Select one of the available fonts in the drop-down list. If required, one can load custom fonts.
Font Size. Select the required font size. Size is set in points, it can be selected in the drop-down list or entered using the keyboard. The range of available values: [8; 36].
Font style. Select font style:
B. Bold.
I. Italic.
U. Underline.
When the button is pressed, the corresponding font style is used. Several styles can be used simultaneously, for example, pressed B and I buttons result in bold italic font style.
To reset the settings and restore the default style, click the Delete button.
In the drop-down palette select tooltip background fill method:
Solid Fill. Default value. Select solid color for tooltip background fill. If required, specify fill opacity percent.
No Fill. Tooltip background fill will not be used. Click the  No Color button.
To reset the settings and restore the default style, click the Delete button.
To set up tooltip area border, set the parameters:
Line Type. Select line type in the drop-down list.
NOTE. Line color setup is available only when the Indicator Color checkbox is deselected.
Line width. Set the required line width using the keyboard or the value editor.
When the Indicator Color checkbox is selected, tooltip area border color matches with the color of the area, for which a tooltip is displayed. The checkbox is selected by default.
To reset the settings and restore the default style, click the Delete button.
See also: