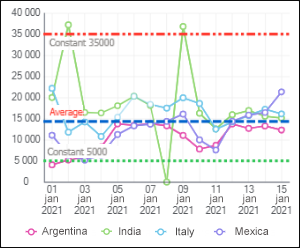
A level level line is a line in the chart plot area that is perpendicular to the specified axis.
NOTE. Level line setup is available for all 2D chart types, except pie charts.
To set up level lines, use the Level Lines group of parameters on the side panel.
 To open the Level Lines group of parameters
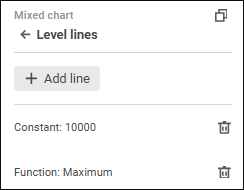
The group of parameters contains the added level lines with names in the format: <level line creation method>:<value>.
To add a level line:
Click the Add Line button. A level line will be added with default settings.
Double-click the level line. The set of parameters opens:
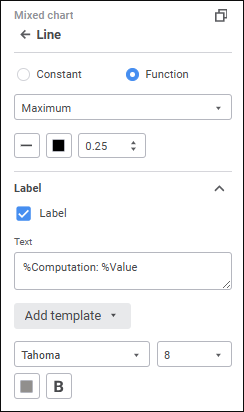
Set the parameters:
To delete level line, click the  Delete button next to the level line name and displayed on level line mouseover.
NOTE. Chart plot area grid also consists of level lines. To set up main level lines in the plot area, use the Gridlines section in the Value Axis group of parameters on the side panel.
See also:

 Settings button on the