In this article:
Working with Object or Report from Repository
Common Operations
On working with objects and reports from repository, the following operations are available:
Refresh data. To refresh data in all document objects, select the
 Refresh item in the Report group on the FORESIGHT ribbon tab.
Set up binding with data source. To unbind all document objects from data sources, click the
 Unbind from Source button in the Report group on the FORESIGHT ribbon tab. As a result, the data is not refreshed in the document when updating it in the source. The document will contain only standard objects.
Export. To export report, click the
 Export button in the Report group on the FORESIGHT ribbon tab. The file save dialog box opens. Available report export formats: express report in the PPEXPRESS (*.ppexpress) format, client cube (*.ppcube). The operation is available on working with express report.
Working with Objects
On adding report objects to presentation, the Report Objects panel is used to work with them:

 Report Objects button in the View group on the Foresight ribbon tab.
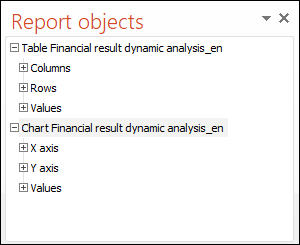
The tree-like structure of the panel is based on the dimensions of objects data sources.
To rename object, select the Rename context menu item.
It is available to set up format of displayed values for tables and expressions. To set up the format, use buttons of the Number Format group on the FORESIGHT tab of the ribbon.
The following standard operations are available when working with objects in Microsoft PowerPoint:
Insert.
Edit data.
Set up hyperlink.
Set up format.
Change style.
Set up chart background.
Resize, etc.
After the work with report objects is finished, go to the step:
Working with Table
A table is an object for showing data from the specified source as a table. Example of a table:
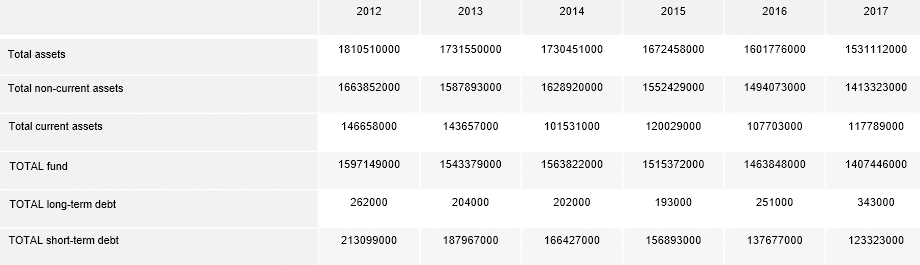
Name of the element corresponding to table is automatically generated following the next rule on the Report Objects panel: Table <Data source name>.
A dimension tree that shows elements selection is created for the element corresponding to the table. Tree elements:
Columns. Dimensions and elements arranged by columns.
Rows. Dimensions and elements arranged by rows.
Values. Fixed dimensions and elements.
 Features of creating a dimension tree
Operations with tables:
Operations available for the elements contained in table rows or columns:
Working with Chart
A chart is an object that is used to graphically represent data from the specified source. For example:

Name of the element corresponding to chart is automatically generated following the next rule on the Report Objects panel: Chart <Data source name>.
A dimension tree that shows the elements selection is created for the element corresponding to the chart. Tree elements:
X axis. Dimensions and elements arranged by columns.
Y axis. Dimensions and elements arranged by rows.
Rows. Fixed dimensions and elements.
Features of creating a dimension tree
Operations with chart:
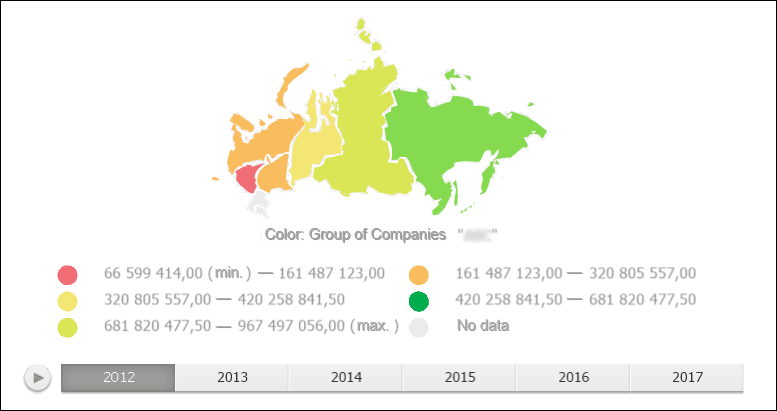
Working with Map
A map is an object that displays source data as a territory map and shows detailed characteristics of regions. For example:
Name of the element corresponding to map is automatically generated following the next rule on the Report Objects panel: Map <Map number in the report>.
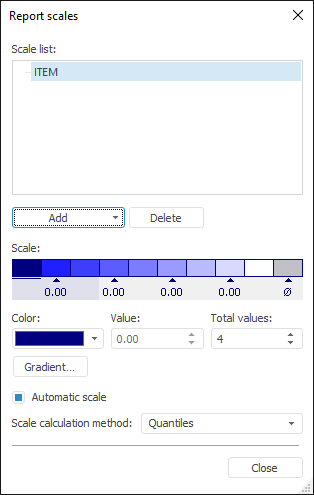
Operations with maps:
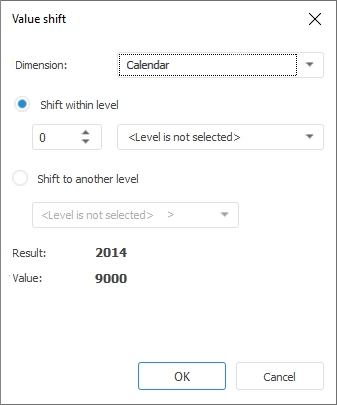
Working with Expression
An expression is a report element calculated based on source data or a custom formula.
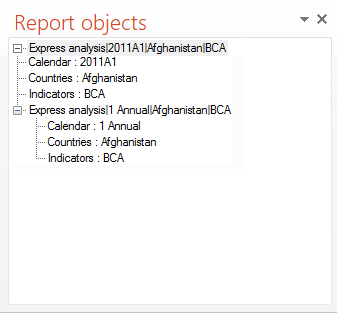
Name of the element corresponding to expression is automatically generated following the next rules on the Report Objects panel:
If the expression is based on a data source: <Data source name>|<Selection of dimension elements and aggregation method>
If the expression is calculated by a custom formula: Expression <Sequence number of the expression>.
The list of dimensions and names of selected elements are displayed for an expression based on a data source.
Operations available only for the expressions based on a data source: