Creating Pixel-Perfect Reports > Getting Started with the Reports Tool in the Web Application > Building Report > Data Visualization on Report Sheet > Data Visualization as Charts > Creating a Chart
To add a chart to report sheet:
Select data source on the Source side panel. Drag the data source to the working area. The top left border of the selected cell will be the left top border of the chart. Select chart type in the drop-down menu of the  Chart item in the popup menu. A chart is added together with a slice.
Put the cursor to the cell, which will be the top left corner of the chart, or select a cell range, to which a chart should be fit in, and select the required chart type:
On the Insert toolbar tab.
In the drop-down menu of the Insert item in the main menu.
In the drop-down menu of the Add Chart item in the slice's context menu on the Sources side panel.
After executing one of the operations:
The selected chart type will be added to the sheet.
A chart named Chart N will be added to the Source side panel, where N - chart number.
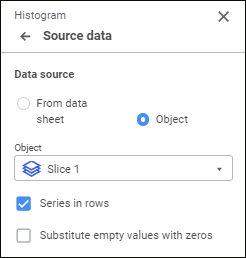
The Source Data group of parameters opens on the parameters panel:
See also:
