When active, a chart enables the user to manage its contents: select series, areas, and so on. To increase report interactivity, chart-generated events can be processed.
To use event handler, select chart in the report sheet, and then select the Event Handler context menu item.
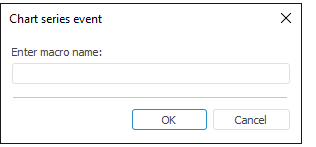
The Chart Series Event dialog box opens:
In the Chart Series Event dialog box, enter name of the macro to execute on clicking the chart series.
Depending on the macro implementation location, the method of specifying path to the macro in this dialog box differs:
If the macro is implemented in a repository unit or form: <Unit or form ID>.<macro name>.
If the macro is implemented in one of the repository assembly objects: <assembly identifier>.<macro name>.
In the units and forms of the repository user macros are to be implemented in the global scope of names (Global Scope).
NOTE. The development environment object that contains macro implementation, it must be connected to regular report.
A macro used as a chart event handler and should have the following signature:
Public Sub OnChartClick(Serie: Integer; Chart: IPrxChart; Point: Integer);
Begin
End Sub OnChartClick;
If a macro is implemented in a standard unit or repository form, the Point parameter, which passes a series point, is optional. If this parameter is not specified, only series index and chart are passed to the macro.
To connect a macro to the chart, create a unit in the Object Navigator dialog box:
Public Sub OnChartClick(Serie: Integer; Chart: IPrxChart; Point: Integer);
Begin
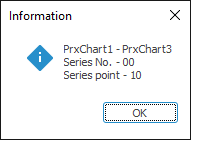
WinApplication.InformationBox("Chart - " + (Chart As ITabObject).Id + #13 + #10 +
"Series No. - " + Serie.ToString + #13 + #10 +
"Series point - " + Point.ToString);
End Sub OnChartClick;
Where OnChartClick is name of the macro; Serie is series number; Chart is a chart; Point is number of the series point.
To execute the example, add links to the Report, Tab and Ui system assemblies.
After connecting this macro, a message appears if the user addresses a series in the chart, for example:
See also:
Getting Started with the Reports Tool in the Web Application | Data Visualization as Charts