In this article:
Viewing and Setting Up System Logs
To monitor system security violations, one can:
View and set up system logs. The system log that identifies events, time, and result of work with mobile platform server. To set up logging parameters on mobile platform server and on mobile device, use the Settings and Global Logging Policy tabs in the System Logs Settings subsection, and the Project Logging Policy tab in a specific project. For details about setting up logging parameters see the Setting Up Log Storage Parameters, Setting Up Device Logging Policy Parameters sections.
View data source requests. Log with detailed debug info about data source requests by a specific API user. To add and set up data source request logging rules, use the Data Source Request Logging Debug Rules tab in the System Logs Settings subsection. For details see the Advanced Logging of Data Source Requests section.
View background tasks. Log of active background tasks and scheduled tasks. To view the background tasks log, use the Background Tasks subsection. For details about background tasks log see the Viewing Background Tasks section.
NOTE. Check if the system time is correct before installing Foresight Mobile Platform. If the user changes the system time after the installation, logging correctness and execution of scheduled tasks are not guaranteed.
To view system logs, use the System Logs subsection in the System Logs and Analytics Tools section:
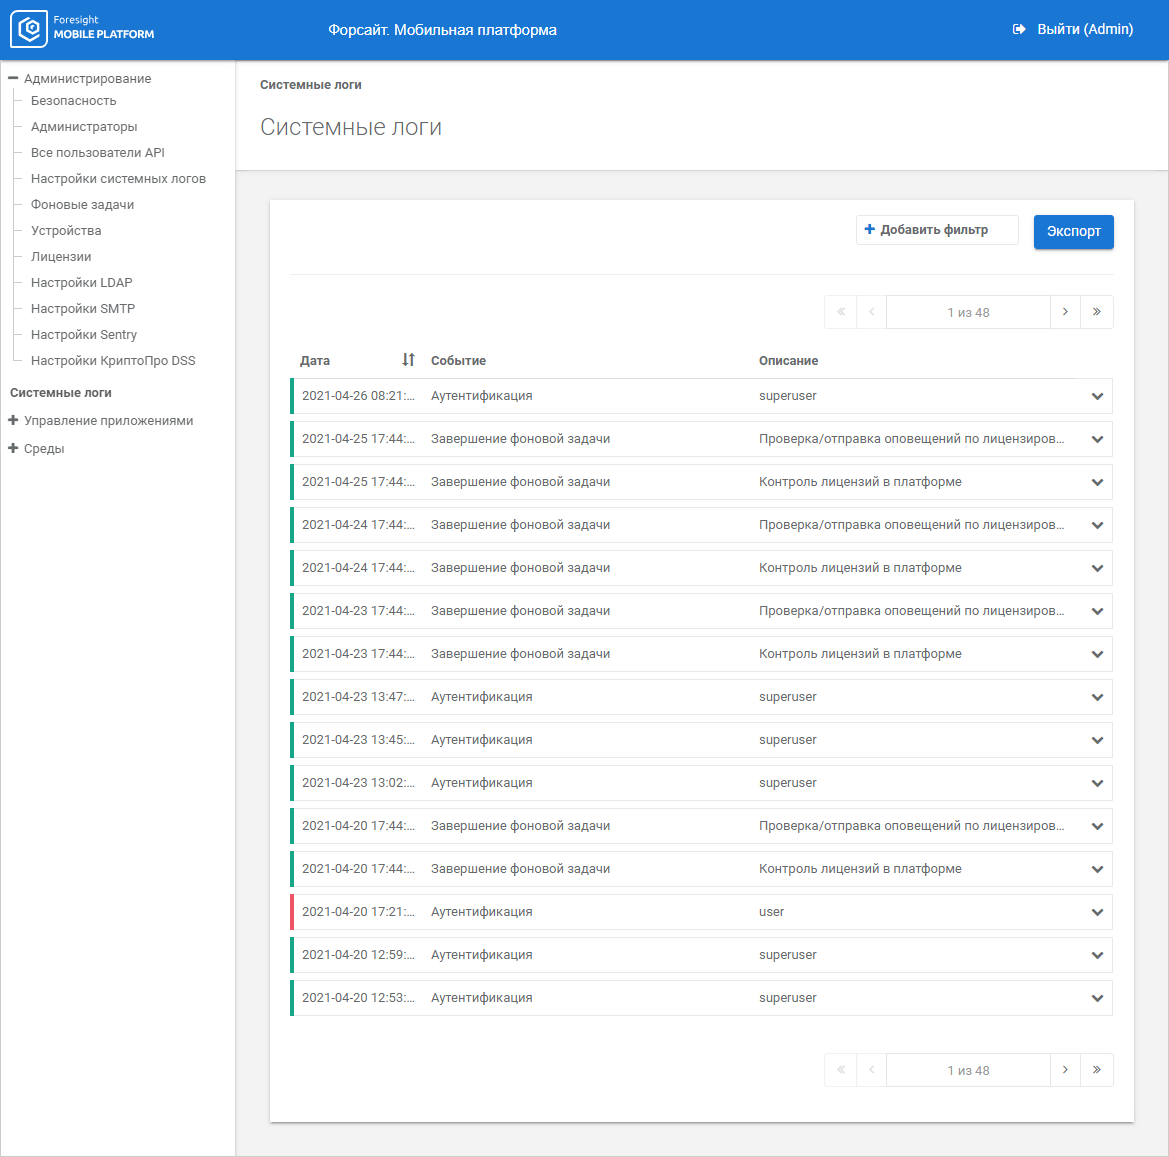
The working area displays logs that enable the user to identify events, time, and result.
IMPORTANT. When project name is changed, the previous system logs generated before name change become unavailable. New system logs are generated for the project with changed name.
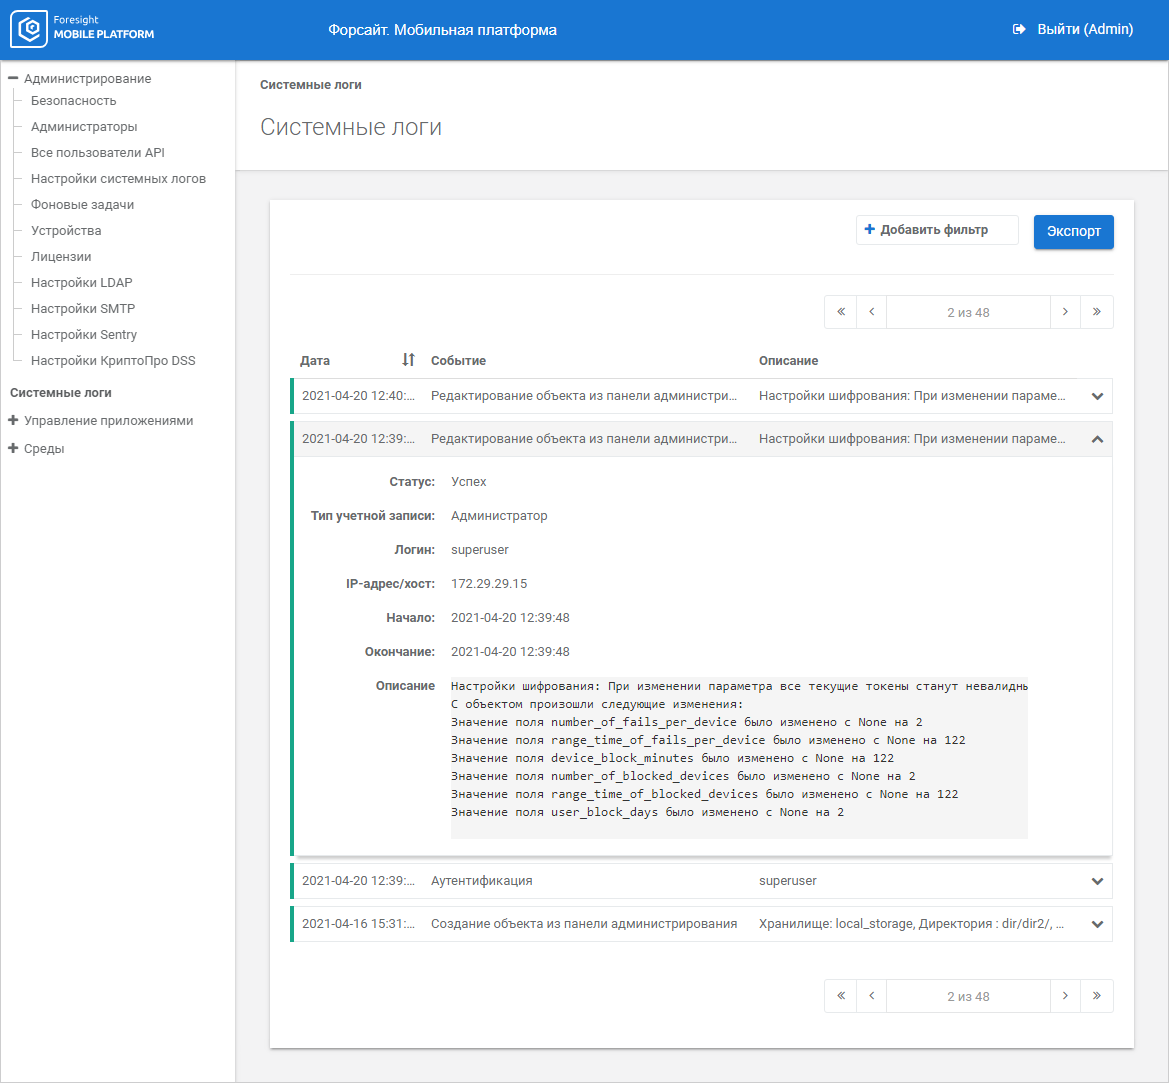
Clicking the event opens its full description:

 Filter logs
 Add Filter button.
Events with the Debug Status
When activating data source request logging rules, the following events: RPC API Request, Web Service Request, and JSON Resource Request are written with the Debug status. Advanced logging is available for the following requests:
/api/v1/rpc/{<resource name>}/.
/api/<v1 or v2>/web/{<resource name>}/.
/api/v1/json/{<resource name>}/.
To view description of events with the Debug status, the administrator should have the Read Debug Logs privilege for one of the access options:
Access to the Environments Section. Events related to resource requests can be viewed by any environment.
Access to Environment. Events related to specific environment resources requests can be viewed.
Access to Project. Events related to specific project resources requests can be viewed.
Color indication determines event execution status. Grey color is used for events with the Debug status containing detailed information obtained according to the added data source request logging rules on the Data Source Request Logging Debug Rules tab in the System Logs Settings subsection.
The event description example:
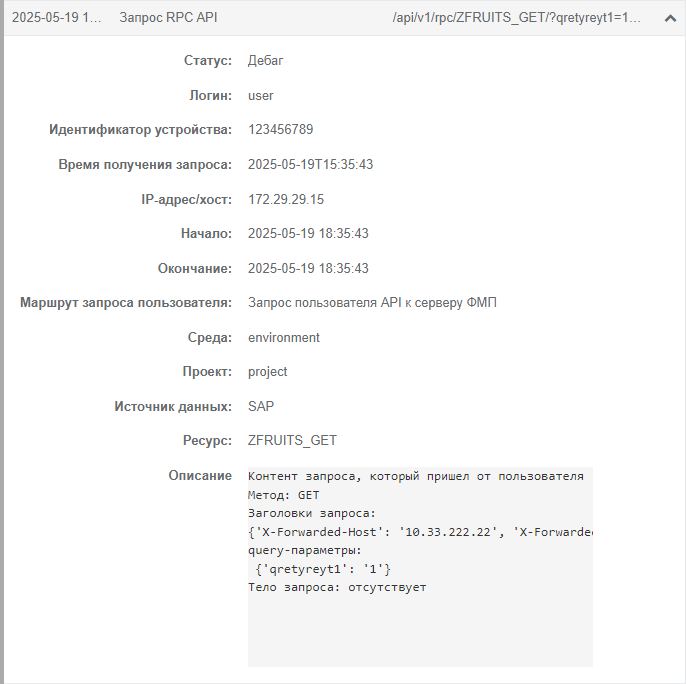
NOTE. Credentials and tokens of API users who sent request are displayed in hashed form without the ability of reconversion.
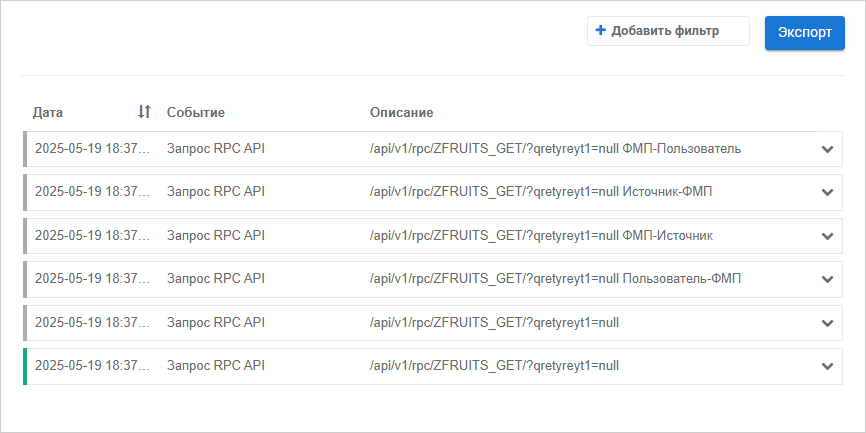
The collapsed event description contains the API method used by the user, and the request handling route in the format: <API method> <sender> - <recipient>, for example:

The example contains the event that describes the request sent by the API user to mobile platform server to get data of the ZFRUITS_GET resource.
Request handling route:
The API user sends request to get resource data to mobile platform server (User - FMP).
Mobile platform server sends request to get resource data to data source/database (FMP - Source/Database).
Data source returns data of the requested resource to mobile platform server (Source/Database - FMP).
Mobile platform server returns resource data to API user (FMP - User).
The route is displayed as linked events.
Viewing Linked Events
Several linked events can be displayed for one API user request.
To view linked events:
Expand main event description with the Success or Error status:
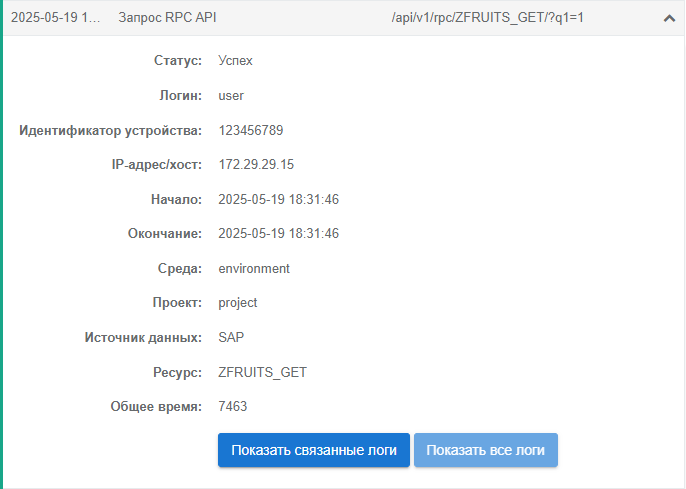
Click the Show Linked Logs button.
After executing the operations the linked events for specific API user request are displayed, for example:
To display all logs, click the Show All Logs button in the main event description.
Loading File with Request Response
The event with the Debug status contains the response that is written to the MinIO/Ceph file storage in the JSON format and can be loaded as a file if the following request handling routes are executed:
Source/Database - FMP.
FMP - User.
To load the file with request response:
Expand event description.
Copy the link to the file with response in the Description box.
NOTE. The file load link is valid during to 365 days since log writing date.
Insert the link to the browser address bar.
After executing the operations loading of the file with request response starts.
The Minio/Ceph storage stores JSON files with responses in the separate section debug-logs-storage located at: debug_logs/<environment name>/<project name>/<resource name>.
JSON file name is created as follows:
Source - FMP: ds_to_fmp_<log writing time at the moment of getting request from the user>.json.
Database - FMP: ds_to_fmp_<log writing time at the moment of getting request from the user>.json.
FMP - User: fmp_to_user_<log writing time at the moment of getting request from the user>.json.
Log writing time format: %d-%m-%Y-%H-%M-%S.
The example of JSON file name: db_to_fmp_1-12-2024-14-55-1.json.
If it is required to clear the file storage from JSON files, delete them using the MinIO/Ceph interface. For details about setting up scheduled deletion of JSON files in MinIO, see the Scheduled Clearing of the MinIO File Storage section.
Executing Request
The event with the Debug status contains commands to execute request from mobile platform server to a specific data source/database. Use appropriate execution tools for different data sources and databases: