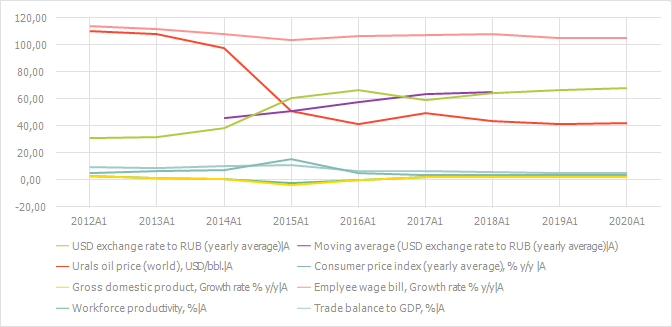
A chart is used for graphic presentation of data contained in the table and is located in the results panel. For example:
If several values of a time series are selected in the table, the chart shows only graphs for the selected values.
If a calculated series or its child series are selected, the chart is plotted on the series selected in the drop-down list of the ![]() Show Series button in the Data group on the Chart ribbon tab.
Show Series button in the Data group on the Chart ribbon tab.
 Select series to be displayed on the chart
A detailed description of features is given in the Setting Up Chart Components section.
See also:
Time Series Data Analysis Mode
