A data table is used to show and work with time series data. Each series has its name, color in a chart and data.
To start working with a table, get data.
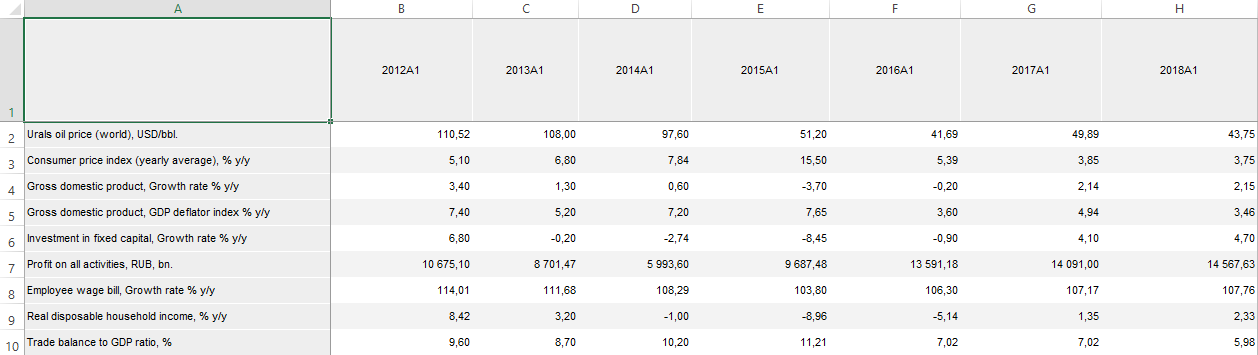
The example of table:
NOTE. If the data is obtained from a time series database, the table is initially empty. To display data, add time series to the table.
Table data can be used to create:
 Set up format of displayed values
See also:
Time Series Data Analysis Mode