To select and set up visualizer data source, use the Sources drop-down list in the upper part of the side panel.
NOTE. The Sources drop-down list is available if at least data source is added.
The following are available as data sources:
Operations available for data sources:
After the data source is added, it is displayed in the list of dimensions on the side panel. Panel appearance depends on the selected data source:
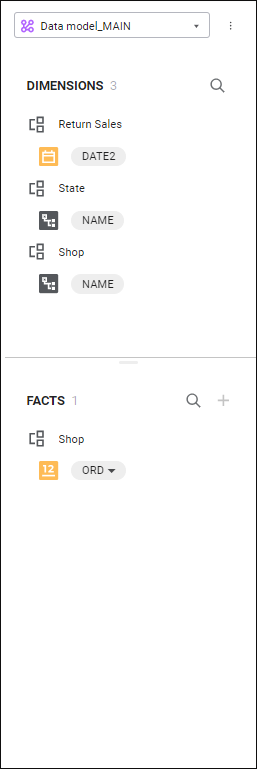
If a data model is selected as a data source, the Dimensions and Facts areas are available for setup on the side panel:
If a standard cube is selected as a data source, to set up data visualization, use the Dimensions area on the side panel:

If alternative hierarchy based on attributes is set up for one or several cube dimensions, the side panel displays the dictionaries by configured attributes for this dimension on the side panel. The Attribute name name is displayed by default for dimensions with hierarchy based on attributes.
Dimensions with hierarchy based on dictionary attributes can be used as additional dimensions to set up data visualization.
After the hierarchy based on dictionary attributes is applied, the dimension is aggregated, elements that are equal by attribute are combined into one element.
To edit data source:
Select the data source in the Sources drop-down list in the upper part of the side panel.
Select the  Edit Model item in the drop-down menu of the
  Actions button of the data source.
Depending on the data source in use, the following opens in a new browser tab:
To delete data source:
Select the data source in the Sources drop-down list in the upper part of the side panel.
Select the  Delete Model item in the drop-down menu of the Actions button.
Confirm deletion in the dialog box.
See also:
Building Information Panel | Creating Data Model | Adding Visualizers and Working with Them

 Show or hide the panel
 Dimensions button. The side panel is displayed by default.
 Dimensions button.
 Add Model > Create New item in the drop-down menu of the
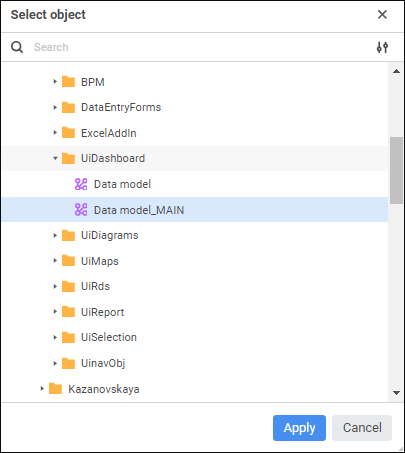
 Show Object button select one of the display options:
 Clear button.