Tap the  button. The Chart dialog box opens.
Select the Data Series item. The Data Series dialog box opens.
Select the series and move the Secondary Axis switch button to the required position.
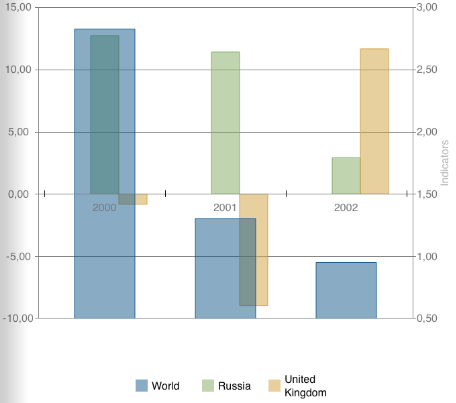
A secondary axis is used:
If the values of different data series on a chart significantly differ from each other.
If different data types are present on a chart.
A secondary axis is displayed for one or several data series.
To show or hide a secondary axis:
Tap the  button. The Chart dialog box opens.
Select the Data Series item. The Data Series dialog box opens.
Select the series and move the Secondary Axis switch button to the required position.
The axis values are automatically calculated according to the primary axis values.
To set up secondary axis parameters:
Tap the  button. The Chart dialog box opens.
Select the Sec. Axis item.
In the dialog box that opens set up the secondary axis with the same settings as for the X, Y axes.
The image below shows a column chart. A secondary axis is added for the World data series:

See also: