To add a chart to report sheet:
Select the required chart type in the Charts group on the Insert ribbon tab.
Press CTRL+ALT+D.
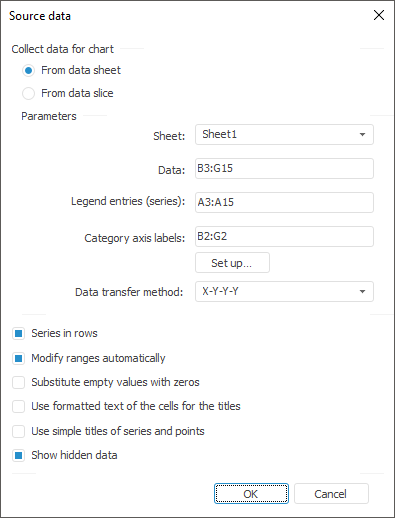
After executing one of the operation the Source Data dialog box opens:

Set chart source data parameters and click the OK button to save.
See also:
Getting Started with the Reports Tool in the Web Application | Data Visualization as Charts