To work with the tool in Foresight Analytics Platform 10, use the new interface.
As an example, consider setting up territory info. A chart that shows data for the territory appears on clicking a hyperlink that contains territory name.
The Cube of Socio-Economic Indicators cube will be used to create a data area. Creation of this cube is described in the Example of Creating a Cube section.
Add this cube to the Data Sources and Data Slices area of the Data Sources and Data Slices panel. Create a slice that will be used to plot data area. Place slice dimensions as follows:
By Columns. Calendar.
By Rows. Territory dimensions.
Fixed. Socio-economic Indicators, Data Sources, Facts.
To set up territory info, execute the following operations:
Make selection in dictionaries.
Create a copy of this slice to be used to plot a chart.
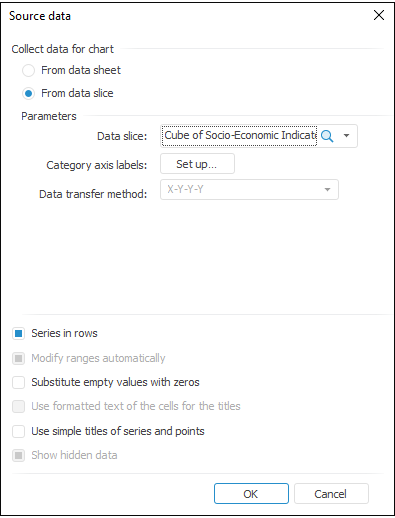
Create a chart on a report sheet and select the From Data Slice source for this chart:
Create another report sheet and drag it from Data Sources and Data Slices dialog box to Slice 1. The Data Area Properties dialog box opens. Go to the Details tab:
Select the Enable Detailing checkbox and set up parameters:
Slice. In the drop-down list select Cube of Socio-Economic Indicators: Slice1. The selection is changed in a dimension of this cube.
Dimension. In the drop-down list select the Territories dimension. Selection of this dimension changes. Changes in selection will affect the data shown in the chart.
Selection Modification Method. Select the Replacement item in the drop-down list. Selection in the dimension changes: only the element, which hyperlink is clicked, is selected.
Select the Show Object in Screen Center as the hyperlink action, and in the Calculation Object box select the previously created chart.
Click the OK button.
Refresh the report. After that the territories in data area are shown as hyperlinks:
Clicking a hyperlink, for example, Sverdlovsk Region, opens a sheet with the chart that contains data for this region:
See also: