 To open the Source Data dialog box:
To populate and edit source data of a chart, use the Source Data dialog box.
 To open the Source Data dialog box:
Add a new chart to the report sheet by selecting the required chart type in the Charts group on the Insert ribbon tab.
Select the predefined chart and select the Source Data context menu item.
After executing one of the operations the Source Data dialog box opens.
The dialog box consists of two groups:
Collect Data for Chart. The group contains radio buttons and parameters to determine chart data source:
From Data Sheet. The selected cell range will be used as the source data.
From Data Slice. A data source slice will be used as the source data.
NOTE. The group parameters look depends on the selected data source.
Chart Data Parameters. The group contains checkboxes to set up chart data parameters.
The radio button is selected by default. An area located on report sheet will be used as the chart data source:
Determine the following parameters after selecting the radio button:
Select the sheet with source data in the drop-down list.
Specify the cell range that contains chart data.
A cell range may be set as a combined or rectangular area. When several ranges are used, chart series are displayed in the order of ranges selection.
Set cell range with series names.
To correctly display the chart horizontal axis and legend:
When the vertical series names range is set, select the Series in Rows checkbox. The specified series names are displayed in the legend.
When the horizontal series names range is set, deselect the Series in Rows checkbox. The specified series names are displayed in the legend.
If the range of names is set as an open range (entire column or row), the value of the cell located at intersection of the data range and the series names range is used as the series name. If multiple ranges are used to build a chart, the ranges of series names should be specified in the same order as the data selection.
NOTE. For waterfall charts, the legend displays predefined names: Increase, Decrease, and Total.
On setting a cell range with legend entries (series), consider the following:
The chart legend does not display the series name, for which there is not values in the specified range.
On using a 3D histogram with groups the series that will be located on the data series axis (Z) are specified in the Legend Entries (Series) box.
On using a 3D histogram with groups with stacking, the cell range including at least two columns or rows, the last of which will be considered on stacking, should be specified in the Legend Entries (Series) box.
Set the cell range with point names.
To correctly display the chart horizontal axis and legend:
When the horizontal point names range is set, select the Series in Rows checkbox. The specified point names are displayed on the horizontal chart axis if there is any.
When the vertical point names range is set, deselect the Series in Rows checkbox. The specified point names are displayed on the horizontal chart axis if there is any.
If a labels range is specified as an open range (entire column or row), the value of the cell located at the intersection of data range and rows labels range is selected as a category axis label.
On setting a cell range with category axis labels, consider the following:
Label of the category axis label is displayed on the histogram if the corresponding cell of category axis label range does not contain values (empty).
On using a 3D histogram with groups the series that will be located on the category axis (X) are specified in the Category Axis Labels box.
On using a waterfall charts the Category Axis Labels box is used to specify the columns that are located on the category axis (X).
Click the Set Up button to set up data labels.
NOTE. The Set Up button is available if a correct cell range is entered in the Category Axis Labels box.
Clicking the button opens the Set Up View of Category Axis Labels dialog box:
The list contains category axis labels accounting for the parameters specified in the Source Data dialog box.
Select checkboxes of the points, labels for which must be displayed on the category axis. To select or deselect all labels, click the Select All or Deselect All buttons.
For the selected points the user can set up tooltips and data labels.
To find a point, click the Find button. A dialog box with the same name appears:
In the Find What box enter full name or some part of the name for the required point. After clicking the Find Next button the focus moves to the first found element. After the next click the focus moves to the next found element, and so on.
The Data Transfer Method box is available only for scatter and bubble charts.
Set data transfer method for scatter chart:
X-Y-Y-Y. When this option is selected, all series have the same values along the X axis. These values are stored either in the top row (when series are displayed in rows) or in the first column (when series are displayed in columns). Other rows or columns contain values of the series along the Y axis.
X-Y-X-Y. If this option is selected, values along the Y and X axes alternate in rows or columns (depending on the series layout). If the series are arranged in rows, the values alternate from top to bottom. If the series are arranged in columns, the values alternate from left to right.
Y-X-X-X. When this option is selected, all series have the same values along the X axis. These values are stored either in the top row (when series are displayed in rows) or in the first column (when series are displayed in columns). Other rows or columns contain values of the series along the Y axis.
Y-X-Y-X. If this option is selected, values along the Y and X axes alternate in rows or columns (depending on the series layout). If the series are arranged in rows, the values alternate from top to bottom. If the series are arranged in columns, the values alternate from left to right.
Set data transfer method for bubble chart:
XYZYZ. When this option is selected, all series have the same values along the X axis. These values are stored either in the top row (when series are displayed in rows) or in the first column (when series are displayed in columns). Values along the Y and X axes alternate in rows or columns (depending on the series layout). If the series are displayed in rows, the values alternate from top to bottom. If the series are displayed in columns, the values alternate from left to right. Where Z - bubble size.
XYZXYZ. If this option is selected, values along the Y, X and Z axes alternate in rows or columns (depending on the series layout). If the series are displayed in rows, the values alternate from top to bottom. If the series are displayed in columns, the values alternate from left to right. Where Z - bubble size.
YXZYXZ. When this option is selected, all series have the same values along the Y axis. These values are stored either in the top row (when series are displayed in rows) or in the first column (when series are displayed in columns). Values along the Y and Z axes alternate in rows or columns (depending on the series layout). If the series are displayed in rows, the values alternate from top to bottom. If the series are displayed in columns, the values alternate from left to right. Where Z - bubble size.
YXZYXZ. If this option is selected, values along the Y, X and Z axes alternate in rows or columns (depending on the series layout). If the series are displayed in rows, the values alternate from top to bottom. If the series are displayed in columns, the values alternate from left to right. Where Z - bubble size.
To set up series layout in columns or in rows, use the Series in Rows checkbox.
If the radio button is selected, an available data slice is used as the chart data source. The Source Data dialog box looks as follows:
Determine the following parameters after selecting the radio button:
Select a slice to use as the chart data source in the drop-down list.
Click the Set Up button to set up data labels. The Set Up View of Category Axis Labels dialog box opens.
NOTE. The Set Up button becomes active after a slice is selected in the Data Slice list for all chart types, except for waterfall charts.
The Data Transfer Method box is available only for scatter and bubble charts.
Set data transfer method for a scatter or bubble chart.
After setting parameters related to data source, set chart data parameters:
Indicate how to interpret numeric series for the specified data area.
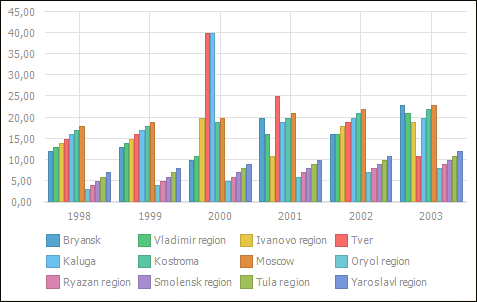
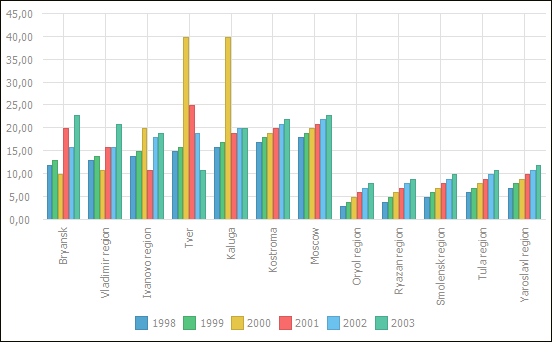
Select the Series In Rows checkbox for creation of value array for data series on the chart by rows. On deselecting the checkbox, an array is created from values by columns.
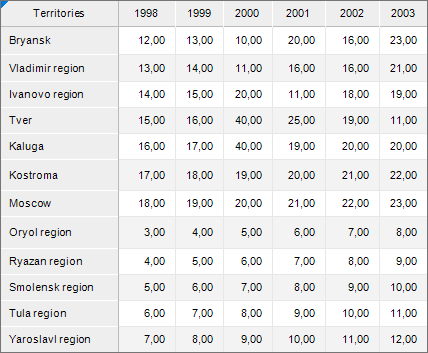
For example of the Series In Rows checkbox selection, built a histogram. As a data source use Volume of Production by Regions, mln. RUB:
Histogram appearance if series are located in rows:
Histogram appearance if series are located in columns:
The checkbox is not available if a slice is used as the chart source.
When the Modify Ranges Automatically checkbox is selected, chart data can be modified automatically according to resizing of the cell range, on which the chart is based. When rows or columns are added to the source cell range, the chart range automatically increases. Accordingly, when rows or columns are deleted, the chart range decreases.
For example, the source chart was based by the table data:
Then the s3 series containing points: -3, 0, 13, 3, 10, -3 is added to the table after the s0 series.
The range of the chart, for which the checkbox is not selected (the left figure), is not changed. Chart source data in this case correspond to the series s0, s3 and s1. The s2 series is not included into the source data.
The range of the chart, for which the checkbox is selected (the right figure), is increased. Chart source data corresponds to the series s0, s3, s1 and s2.
Substitute empty values with zeros
If the Substitute Empty Values with Zeros checkbox is selected, empty values are automatically substituted with zeros. If the checkbox is deselected, the intervals containing empty values are displayed as a dashed line and connect two nearest present values.
Use formatted text of cells for titles
The checkbox is not available if a slice is used as the chart source.
If the Use Formatted Text of the Cells for the Titles checkbox is selected, names of chart series and points are formed regarding text formatting in the cell. If the checkbox is deselected, the names are generated based on the non-formatted cell text. The checkbox is deselected by default.
NOTE. The formatted text is understood as data display format (ITabRange.FormattedText).
See below an example of chart names for a data area with text formatting applied to its titles. The left figure shows chart appearance with deselected checkbox, the right figure shows chart appearance with the selected checkbox:
In this case the following cell text formatting is applied:
For series titles:
Text style is turned to underlined.
Title of the "2001" series is highlighted with red color.
Text in point titles is turned to italic and bold.
Use simple titles of series and points
When the Use Simple Titles of Series and Points checkbox is deselected, all parent names are used to edit names of chart series and points. If the checkbox is selected, series and point names are generated based on the name of the last parent.
Below is an example that displays chart labels for the table presented with the deselected (left) and selected (right) checkbox.
When the Show Hidden Data checkbox is selected, the chart can show all data area values, including data contained in hidden rows or columns and data of the rows or columns with zero height or width. If the checkbox is deselected, the chart is built using only the visible part of the data area. The checkbox is selected by default. The checkbox is not available if a slice is used as the chart source.
See below an example of a chart with some of the rows hidden with the checkbox selected (left) and deselected (right):
See also:
Getting Started with the Reports Tool in the Web Application | Creating a Chart