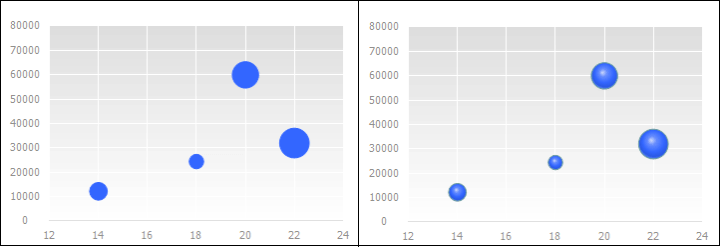
A bubble chart is a type of scatter chart, in which data points are replaced with bubbles, their size acts as additional data dimension. Bubble charts are often used to present financial data. Bubbles of different size enable the user to visually highlight particular values.
Bubble chart enables the user to show three sets of values. The third value determines a bubble size. Bubbles can be shown in 2D or 3D. 3D form of the bubbles is achieved by using glossy fill.
Example of bubble chart:

NOTE. In the express report in the desktop application, a simplified version of the component is connected. The data is alternated as X-Y-Y-Y-Y, Z = 1.
The following chart parameters can also be changed in the edit mode:
See also:
Chart Types | Setting Up General Chart Parameters | Setting Up Chart Components