 Create a model copy
Follow the steps:
Select the Save As item in the context menu. The dialog box opens for selecting a storage location of the model copy in the current repository. Specify a new name of object, and, if required, identifier in the dialog box. If identifier is not specified, it is created automatically on saving.
IMPORTANT. Identifier of the saved object must not contain Cyrillic characters and spaces.
To refresh a model, click the  button on the View ribbon tab.
 View equation calculation results
To view equation calculation parameters, use side panel tabs. Tabs set depends on the equation type. This set always includes the Equation tab that is used to set up basic parameters of equation.
To display tabs:
Make sure that the side panel is displayed.
Select the output variable or one of the equation links.
A detailed description of displayed parameters is given in the Setting Up Equation Parameters section.
View order of model calculation
To view order of model calculation, click the  Calculation Order button on the Calculation ribbon tab. The Calculation Order dialog box opens, which contains all model equations placed in the order of calculation:
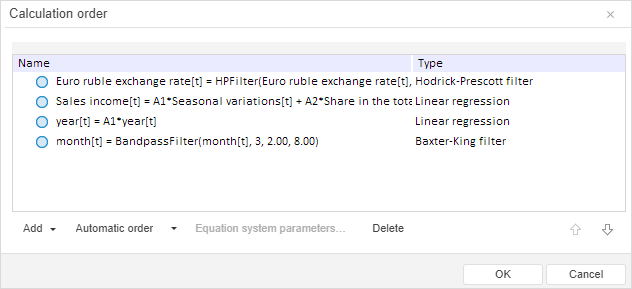
NOTE. Changing of calculation order is not available.
The calculation is executed by using buttons on the Calculation ribbon tab. To calculate a model:
Get familiar with calculation periods in the Sample Period and Forecasting Period groups. Changing of calculation periods is not available.
If scenario modeling is applied, select those scenarios in the Scenarios drop-down list, by which it is required to calculate the model. By default, calculation is executed only by the Fact scenario.
TIP. How to find out whether scenario modeling is used?
Scenario modeling is used if the Use Scenario Modeling checkbox is selected on the Interface tab in the Parameters dialog box.
Select calculation type. Click the lower part of the  Calculate button. The menu opens, in which select the type of model calculation:
Forecasting Problem. Model equations are calculated one by one in each scenario point: first, all equations are calculated by the first scenario point, then all equations are calculated by the second scenario point, and so on.
Optimal Control Problem. It is available if criterion function is set. It consists in searching for such values of controlling variables, at which the condition of criterion function value optimization is met.
Criterion Problem. It is available if trajectory is set for criterion function. It consists in finding such values of controlling variables, at which criterion function value will maximally correspond to the set trajectory.
Click the Calculate button.
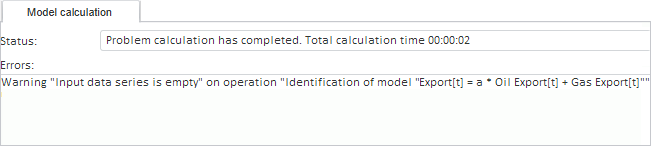
The current model calculation status and errors or warnings are displayed in the results panel on the Model Calculation tab. To show the tab, click the  Calculation Log button on the View ribbon tab.
For example:
View equation calculation results
To view equation calculation results, use results panel tabs.
To display tabs:
Make sure that the results panel is displayed.
Select the output variable or one of the equation links.
Tabs set depends on the equation type.
The following types of reports are available for the model:
Report on variables. Data of all variables included in the model is presented.
Scenarios comparison report. It is available if scenario modeling is used. Data of all variables is presented allowing to compare data by all scenarios contained in the model.
To get the model report:
Click the lower part of the  Report button on the Calculation ribbon tab.
In the menu that opens select the radio button next to the required report type.
The express report containing data about the model opens in a new window.
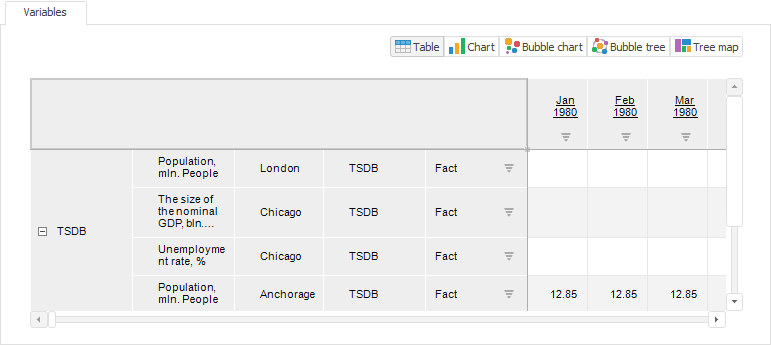
Both reports contain the Variables sheet that includes input and output variables as tables for the selected period by all considered scenarios. For example:
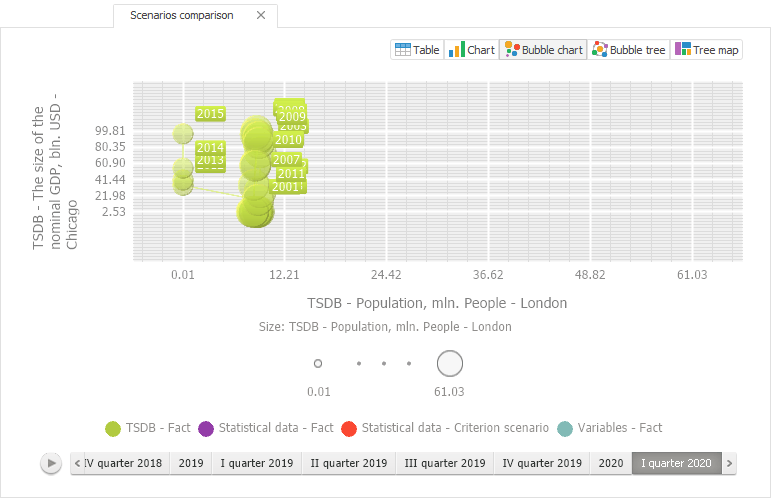
The scenarios comparison report also contains the Scenarios Comparison sheet that includes input and output variables presented as a bubble chart. Scenarios are used as observation objects, variables are used as metrics. The characteristic feature of this bubble chart is that movement trajectory is drawn for each bubble. For example:
NOTE. The option is available only for the Schema view.
To export a model, select the Export > Schema item in the Model main menu and select export format:
PNG file (Line.png).
SVG file (Schema.svg).
The model schema is exported to the file of the specified format to the downloads folder used by the browser.
Calculate descriptive statistics of variable
Descriptive statistics are a wide set of data analysis methods that enable the user to find dependencies between variables, determine direction of this dependency, and calculate various summary statistics.
To calculate descriptive statistics, select one or more variables in the data view area. Calculation results are displayed on the Descriptive Statistics tab on the results panel.
Diagnostic tests are used to check linear regression model for violation of fundamental hypothesis. The tests also help check whether regression model is specified correctly.
To run tests, select the output variable or one of the links in the linear regression equation. Calculation results are shown on the Diagnostic Tests tab on the results panel.
See also: