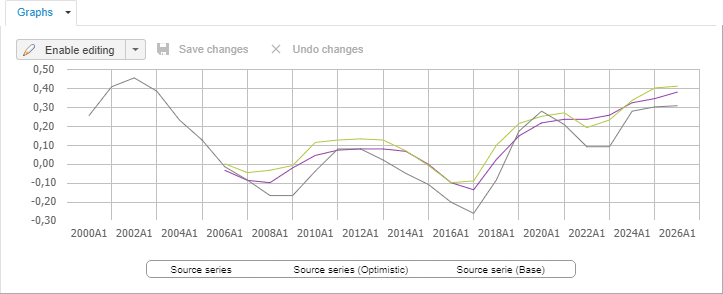
If a model is calculated by the number of scenarios, a graph displays values for each calendar scenario. Scenario name is shown in round brackets next to the series name in the legend. For example:

The period of displaying data on the equation line depends on the graph contents and data filtering.
| Filter status | Graph contents | Displayed data |
| Filter is not determined | The graph contains all series: forecasting series, sample series, factors. | Data for the entire period. |
| The graph contains only sample series. | Data for the entire sample period. | |
| The graph contains only forecasting series. | Data for the entire forecasting period. | |
| Filter is set | The graph contains all series: forecasting series, sample series, factors. | If the following series are selected in the legend:
|
| The graph contains only sample series. | Data on the entire sample series is displayed taking into account filtering. | |
| The graph contains only forecasting series. | Data on the entire forecasting period taking into account filtering. |
See also: