Tool interfaces in the web application and in the desktop application are identical, and differences in functionality are given in appropiate commments.
Report data is displayed in a table that is generated by source dimension element selection. Different data visualizers are based on a table (chart, map, bubble chart, and so on).
Operations with express report data are executed by means of:
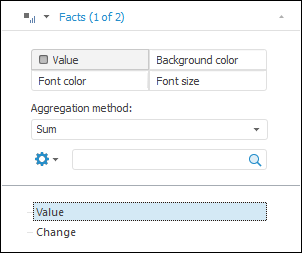
The Selection tab of the side panel. If a fixed dimension is selected with the Metric selected role, data aggregation is available:
The Data ribbon tab:

The following operations are available when working with all report data visualizers:
See also:
Working with Ready Express Report