The development environment in the web application allows for debugging repository objects that use connected units/web forms. The following objects can be debugged:
To open an object for debugging:
Open the Fore unit used by repository object in the development environment. Put breakpoints in required places.
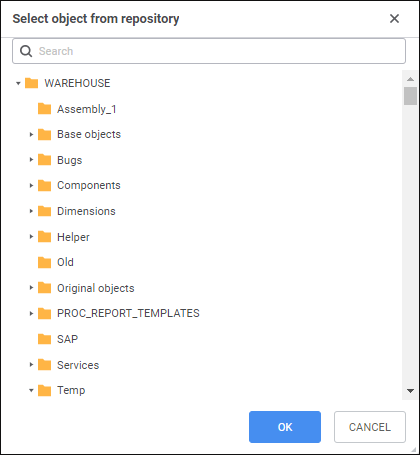
Select the Debug > Open Object for Debugging main menu item. The Select Object from Repository dialog box opens:
In the dialog box select the required repository object. To quickly find an object, start typing its partial or full name in the search string.
Click the OK button.
After executing the operations the selected object debugging starts. The object will be opened for view in a new browser tab. If operations are being executed that may result in Fore code execution and reaching the breakpoint, the development environment tab title displays the  Debug text. Go to the development environment tab to continue debugging.
To pause object debugging, click the  Pause Code Execution button or select the Debug > Pause Code Execution main menu item.
To finish object debugging, execute one of the operations:
Press CTRL+F2.
Click the  Stop Code Execution button.
Select the Debug > Stop Code Execution main menu item.
Close the tab with the object opened for view.
See also: