Enabling Monitoring and Logging of Mobile Platform Components
To work with mobile platform components, enable monitoring and/or logging of components if required:
Monitoring can be used to track the state of mobile platform components using various metrics, for example, the number of HTTP requests waiting for execution in the Docker container; CPU utilization, and so on.
Logging can be used to detect system errors using technical logs.
Monitoring of Mobile Platform Components
To monitor mobile platform components on cluster, the system uses preinstalled applications - Prometheus and Grafana in OpenShift.
To monitor mobile platform components:
NOTE. If the Grafana application has been already installed, go to Step 4.
Create a configuration for the Prometheus application in the cluster terminal, which will be used to request data from user services:
cat <<EOF | oc apply -f -
apiVersion: v1
kind: ConfigMap
metadata:
  name: cluster-monitoring-config
  namespace: openshift-monitoring
data:
  config.yaml: |
    enableUserWorkload: true
EOF
Create a namespace for the Grafana application:
oc create namespace fmp-monitoring
Install the Grafana application:
helm install -n fmp-monitoring fmp-grafana \
   ./grafana/grafana-5.2.9.tgz \
   -f ./grafana/values.yaml \
   --set ingress.hostname=grafana.${CLUSTER_HOST}
Where:
grafana.${CLUSTER_HOST}. Host, at which the Grafana service will be available. The CLUSTER_HOST variable has been declared before.
Set access permissions for cluster monitoring when working with the Prometheus application:
oc adm policy add-cluster-role-to-user cluster-monitoring-view -z fmp-grafana -n fmp-monitoring
A Service Account for Grafana named fmp-grafana has been created automatically.
Get the token that allows for the use of Prometheus:
PROMETHEUS_TOKEN=$(oc serviceaccounts get-token -n fmp-monitoring fmp-grafana)
Set variables on installing or updating mobile platform to create a data source in the Prometheus application and working areas in the Grafana application.
NOTE. If the Grafana application has already contained a data source, create only working areas.
Variables for connecting to Grafana if the Grafana application has been already installed:
--set initGrafana.host=grafana.com. Host for connecting to Grafana.
--set initGrafana.username=root. User name for connecting to Grafana.
--set initGrafana.password=secret. User password for connecting to Grafana.
Variables for creating a data source in Grafana:
--set initGrafana.datasources.enabled=true. Access to creating a data source. The variable is set to false by default.
--set initGrafana.datasources.prometheus_host=thanos-querier.openshift-monitoring.svc.cluster.local:9091. Host for using the Prometheus non-standard application.
--set initGrafana.datasources.prometheus_token=${PROMETHEUS_TOKEN}. The obtained token that allows for the use of Prometheus.
Variables for creating working areas in Grafana:
--set initGrafana.dashboards.enabled=true. Access to creating a data source. The variable is set to false by default.
--set initGrafana.dashboards.datasource_name=Prometheus. Name of the data source for working areas if the Grafana application has already contained a data source.
After executing the operations, monitoring of mobile platform components is enabled. Open the Grafana application to view metrics collected for mobile platform components and to display their change in time.
The example of displaying CPU resources usage:
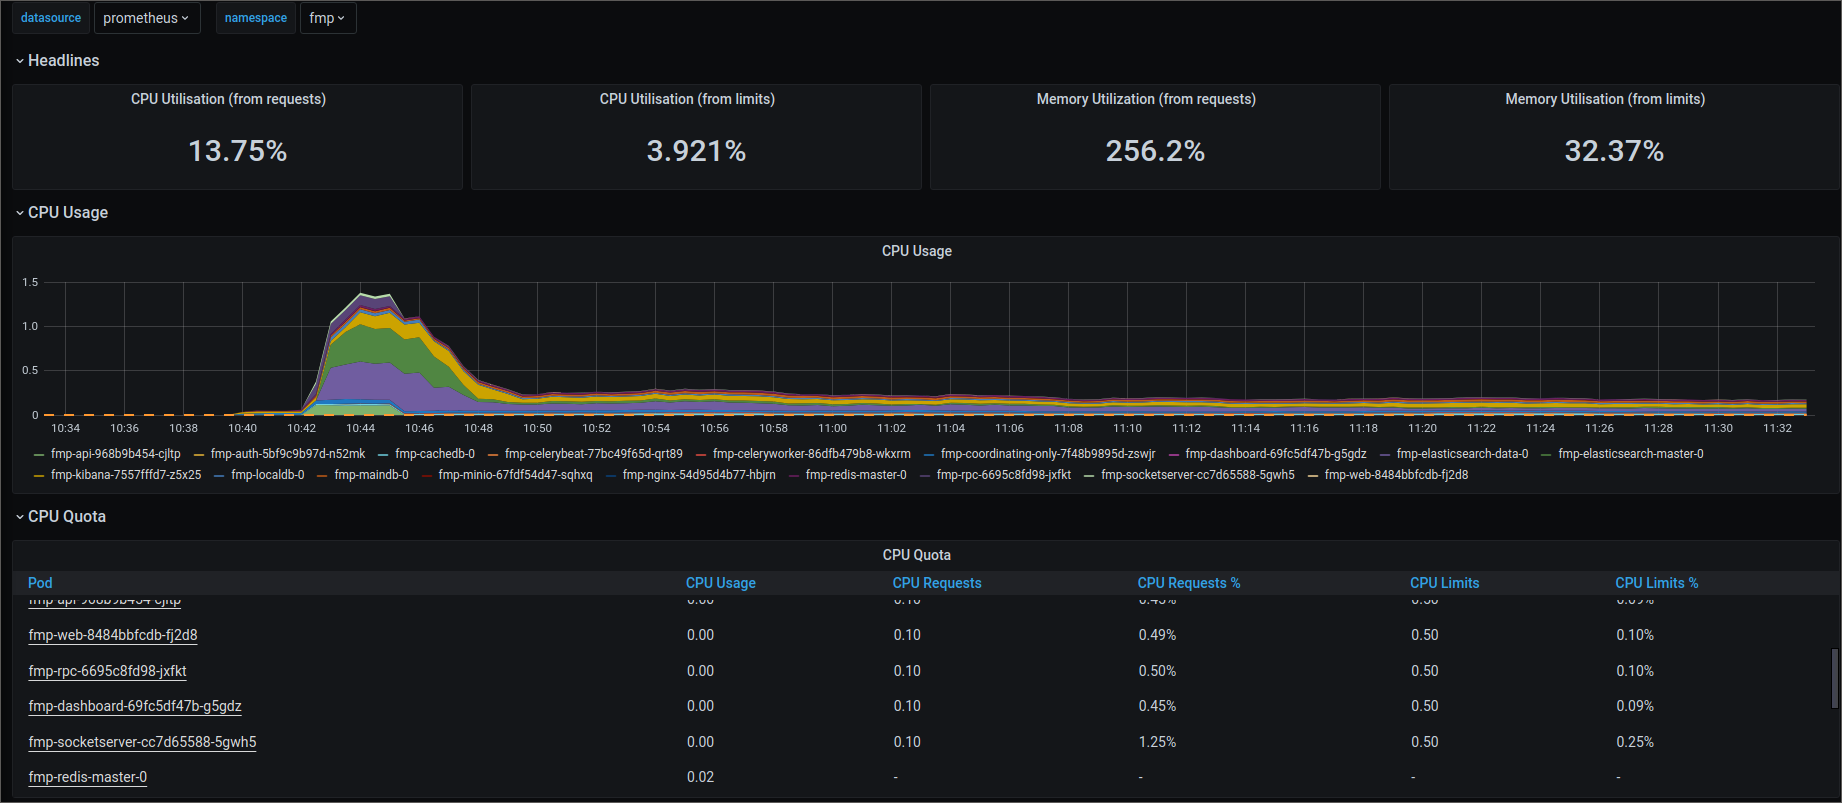
For details about working with the Grafana application see the Checking System Resource Volume Usage in Grafana section.
Logging of Mobile Platform Components
Centralized logging of mobile platform resources can be executed by preinstalled applications - fluentd and Kibana. The fluentd application allows for collecting logs in the Elasticsearch search engine built-in Foresight Mobile Platform.
To log mobile platform components, set the variable on installing or updating mobile platform using Helm Values:
--set fluentd.enabled=true
After executing the operation, logging of mobile platform components is enabled.
To view and export technical logs, see the System Error Monitoring section.