In this article:
Checking System Resource Usage Volume in Grafana
To execute diagnostics and eliminate system errors, open the Grafana application:
One can view in the application:
Viewing System Resource Volume Used by Containers
To view CPU and RAM usage by containers:
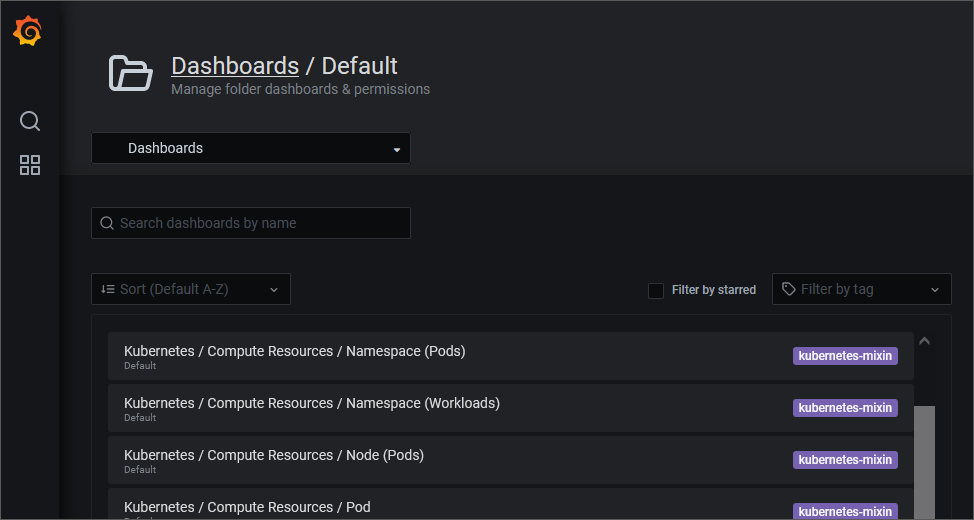
Open the Kubernetes/Compute Resources/Namespace (Pods) dashboard on the Dashboards page:
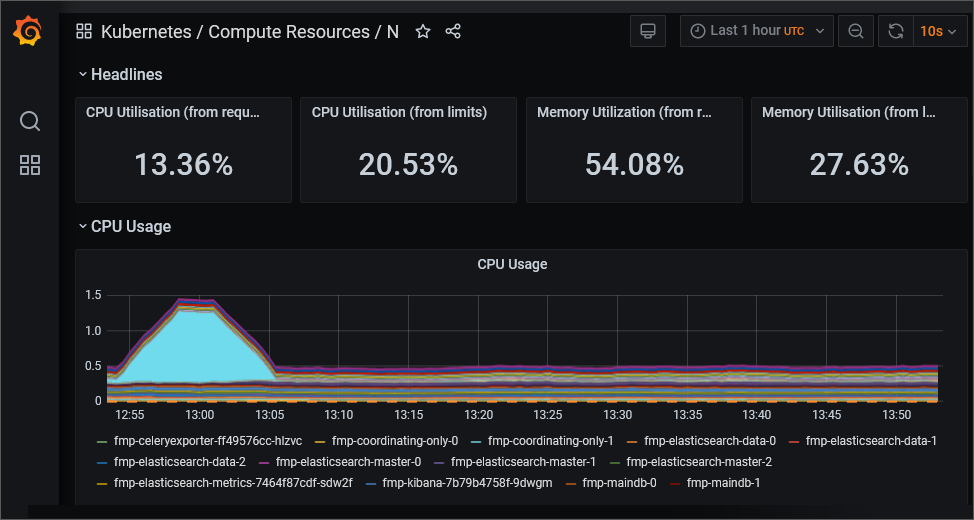
By default, a chart displays statistics of system resources usage volume by all pods. To show the statistic by a specific pod, hover the cursor on the chart point. After executing the operation a tooltip is displayed with pod name and corresponding resource usage value, for example:
A legend can also be used to display statistics by specific pods.
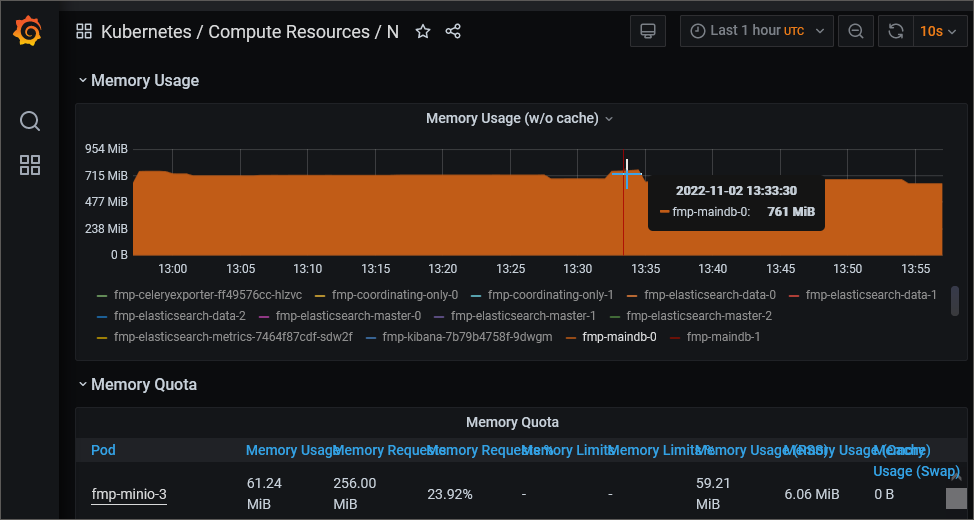
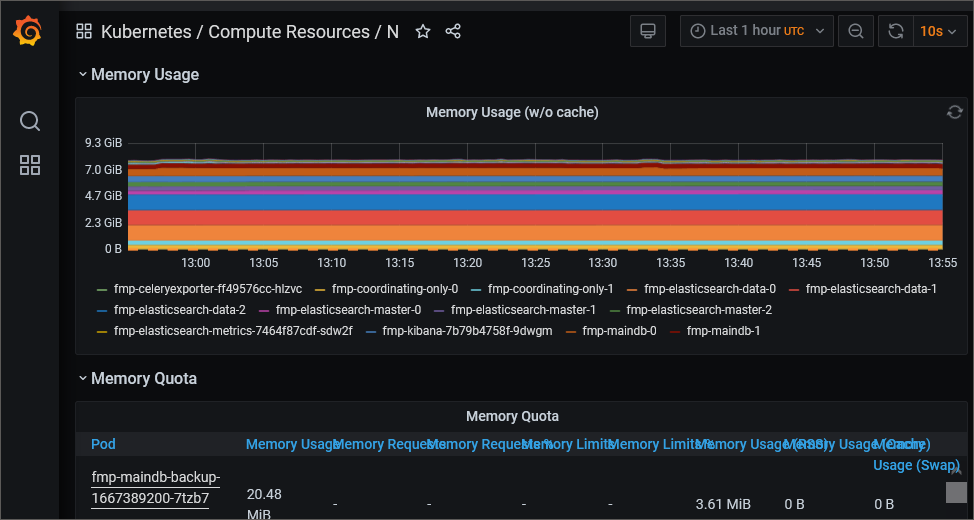
The example of a chart showing RAM resources usage by different pods:
Analyze system resource usage volume:
Find the minimum and the maximum values on the chart, which are visually different from the average values.
Determine the CPU Usage and the Memory Usage values on the chart and compare them with the corresponding values of CPU Limits in the CPU Quota block and with the corresponding values of Memory Limits in the Memory Quota block. If the CPU Usage and the Memory Usage values are approximated, pod containers use the maximum of allocated resources.
Register the time when anomalous maximum peaks appear that are accompanied with excessive resource usage.
Find the pod logs that were written in the specified time and analyze which processes are accompanied with anomalous resource usage.
Viewing Volume of System Resources Used by Cluster Nodes
To view CPU and RAM usage by cluster nodes, open the USE Method/Node dashboard on the Dashboards page:
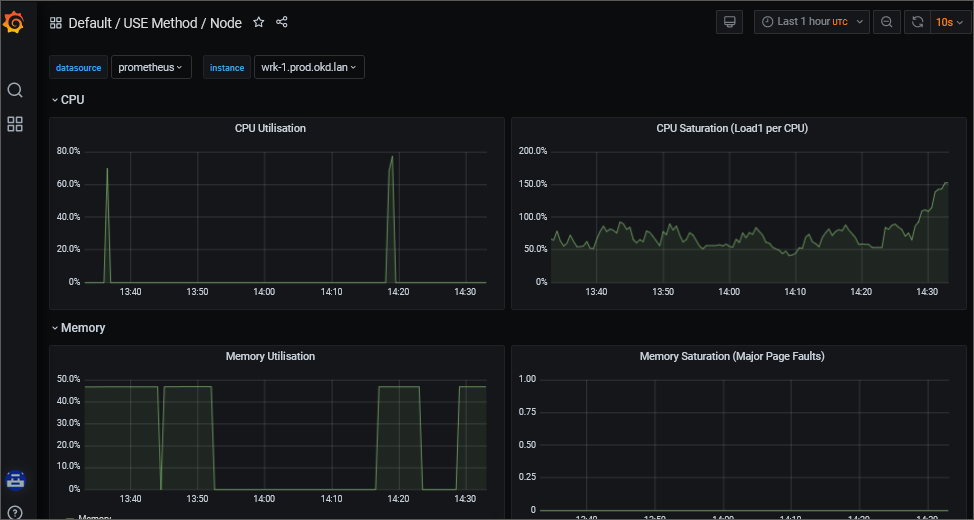
If required, select a specific cluster node in the "instance" drop-down list to analyze the obtained information.