Checking Technical Logs and System in Kibana
To detect and execute diagnostics of system errors, open the Kibana application at:
http://<IP address or DNS server name>:5601
After executing the operation, the Kibana administrator panel opens:
One can view in the application:
To export technical logs to a *.csv file using Kibana, see the Exporting Technical Logs section.
Viewing Technical Logs
To view technical logs:
Go to the Discover section on the side panel:
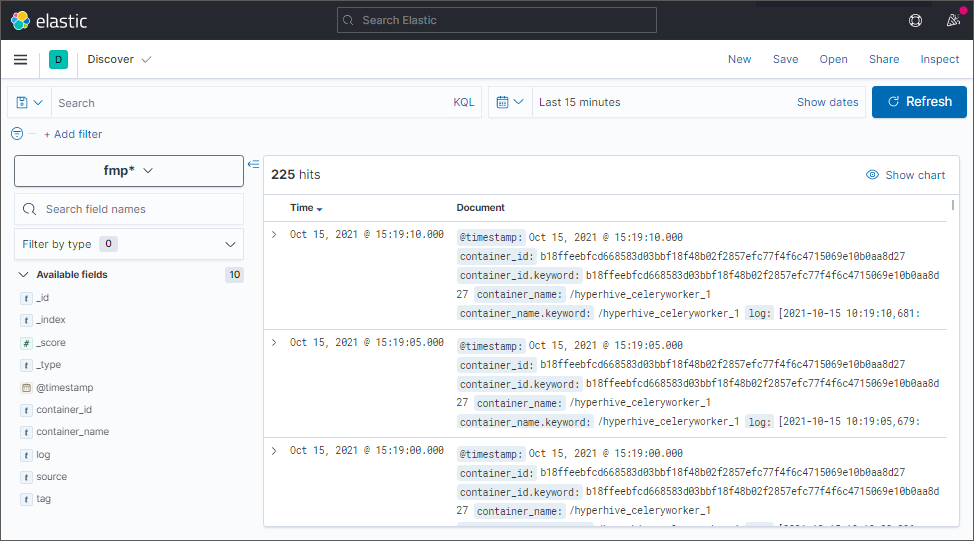
If required, set up log filtering, create patterns and/or use the search bar to search for specific logs. After executing the operation save the changes using the Save button in the main menu. The fmp* pattern is used by default, it contains all Docker containers.
After executing the operations the list of technical logs is displayed.
Explaining Technical Logs
Each technical log contains the following information:
_id. Log identifier.
_index. Log index in the format: fmp_<service name>_YYY.MM.DD.
_score. Score generated based on matching fields in the search query and in the log. It displays the degree of matching the log to the search query.
_type. Log type. It is used to store several log types in one index and allows for logical separation of data inside the index. For example, it is available to create the http and https types for the WWW index.
@timestamp. Log date and time.
container_id. Identifier of the Docker container, from which the log is obtained.
container_name. Docker container name.
log. Log text.
source. Log source. As a source, the system uses a resource that is an input-output UNIX stream:
stdout. Standard output stream.
stderr. Error output stream.
tag. Log tag.
If a system error occurs, the log text will contain "error".
Viewing Statistical Information about the System
To view statistical information about the system, go to the Analytics > Visualize Library section on the side panel:
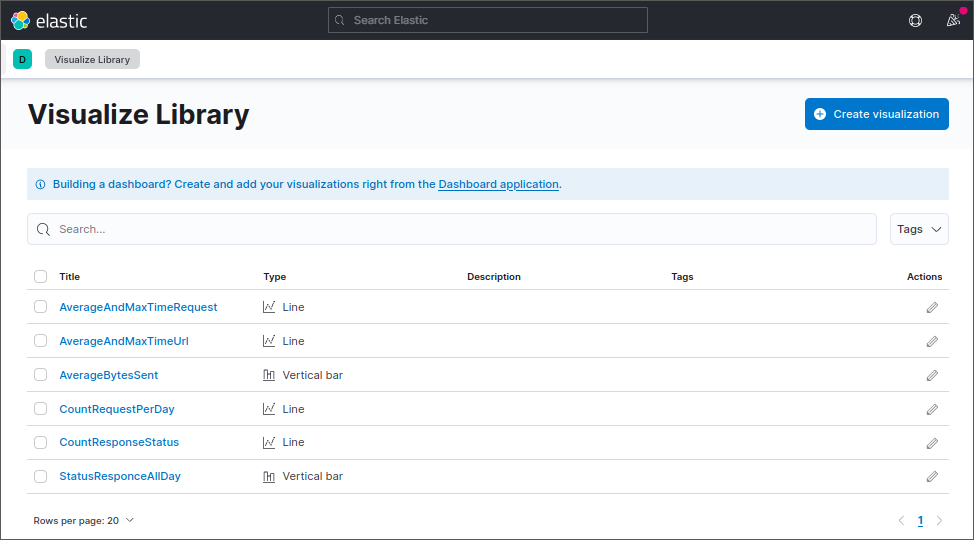
After executing the operation, the list of various charts is obtained, which can be used for analysis of statistical information about the system:
AverageAndMaxTimeRequest. Average and maximum request time.
AverageAndMaxTimeUrl. Average and maximum request time for different URLs.
AverageBytesSent. Average number of sent bytes.
CountRequestPerDay. Number of daily requests.
CountResponseStatus. Number of server responses with a specific status.
StatusResponceAllDay. Comparative chart with the number of server responses with a specific status.