 To open the administrator panel
To export technical logs in the Kibana application:
Allow access to Kibana in the cluster deployed based on OKD/OCP by executing the command:
oc port-forward deployment/fmp-kibana 5601:5601 -n fmp
NOTE. If standalone configuration of Foresight Mobile Platform is used, skip this step.
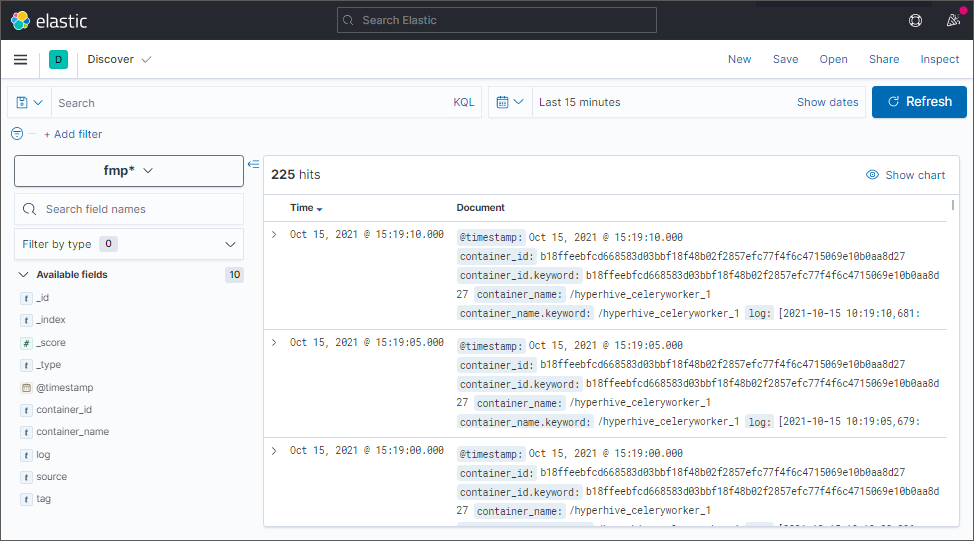
Open the Kibana administrator panel and go to the Discover section on the side panel.
 To open the administrator panel

If required, set up log filtering, create patterns and/or use the search box to export a specific logs. After executing the operation save the changes using the Save button in the main menu. The fmp* pattern is used by default, it contains all Docker containers:
Select the Share > CSV Reports > Generate CSV main menu item. After executing the operation, a message about generation of log file in the *.csv format is displayed.
Download the generated *.csv file in one of the ways:
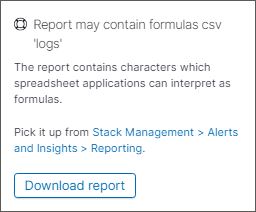
Click the Download Report button in the window displayed after the file is generated:

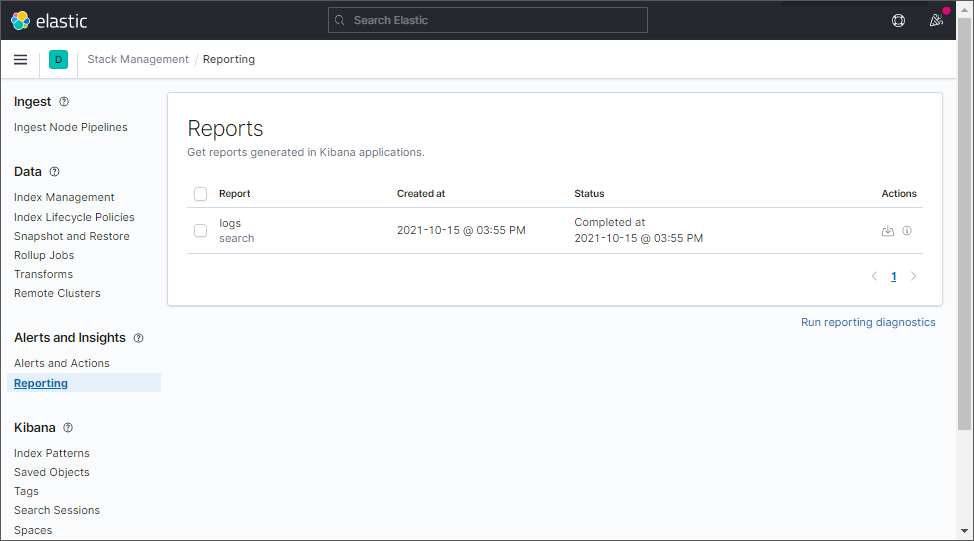
Go to the Stack Management > Reporting section on the side panel and click the  Download Report button located next to the created file:

After executing the operations, a file with technical logs will be downloaded in the *.csv format.
To decrypt logs, see the Checking Technical Logs and System in Kibana section.
See also: