Click the  Bubble Tree button in the Insert tab of the FORESIGHT ribbon tab.
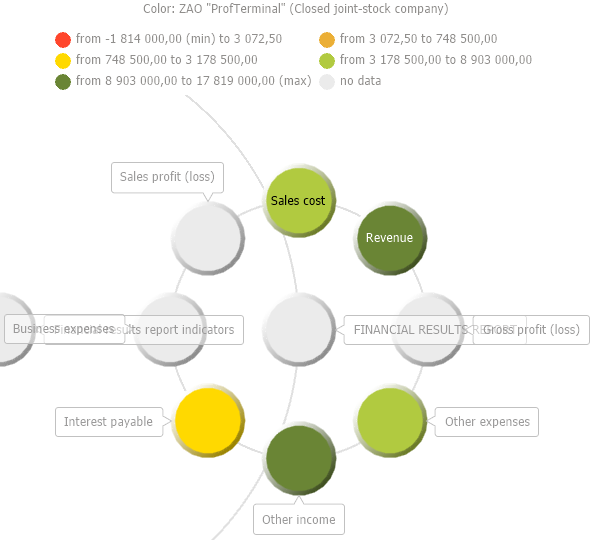
A bubble tree is a way of visualizing hierarchical data as a set of interrelated bubbles. Each hierarchical branch is represented with a bubble related with the bubbles that are elements of the same hierarchical level. All elements of the same branch and the same hierarchical level form a circle, the center of which shows the parent element of the hierarchy. The diameter of each bubble is proportional to value of the corresponding hierarchical element. Bubble color is also determined by hierarchy element's value.
A bubble tree enables the user to display two-value sets for hierarchical data:
The first value determines the bubble color.
The second value determines the bubble diameter.
Bubble tree advantages:
It shows the interrelation between two indicators in a hierarchical data structure.
It graphically shows relations between hierarchical elements.
To get started with a bubble tree:
Click the Bubble Tree button in the Insert tab of the FORESIGHT ribbon tab.
A bubble tree is created on a separate sheet in a Microsoft Excel workbook. A bubble tree sheet is inserted after the active sheet in a Microsoft Excel workbook.
NOTE. One table can be used as a data source only for one bubble tree.
Example of bubble tree:
Use the Format group of tabs on the side panel to determine bubble tree settings:
Bubble tree fill.
NOTE. The setup is similar to setup of fill of the Map data view.
See also: