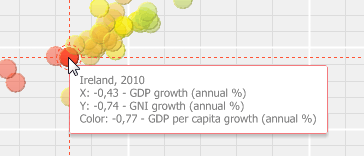
Tooltips are used to show additional information about element. Tooltip settings are identical for the visualizers: Bubble Chart, Bubble Tree and Tree Map. Example of tooltip:

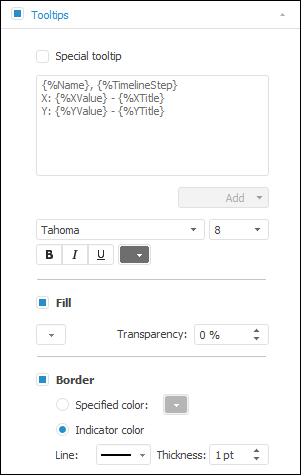
Tooltips are enabled by default. To make tooltips visible, select the checkbox in the Tooltips tab title on the side panel. To set up tooltips, use the same side panel tab.

After the Tooltips checkbox is selected, the following settings are available:
See also: