Click the  Bubble Chart button in the Insert group of the FORESIGHT ribbon tab.
A bubble chart is a scatter chart, in which data points are replaced with bubbles. The bubble size is an additional data dimension. A bubble chart does not have the category axis. Horizontal and vertical axes are value axes.
A bubble chart enables the user to display sets of four values:
First value: by X axis.
Second value: by Y axis.
Third value: bubble size.
Fourth value: bubble color.
To get started with a bubble chart:
Click the Bubble Chart button in the Insert group of the FORESIGHT ribbon tab.
A bubble chart is created on a separate sheet in a Microsoft Excel workbook. A bubble chart sheet is inserted after the active sheet in a Microsoft Excel workbook.
NOTE. One table can be used as a data source only for one bubble chart.
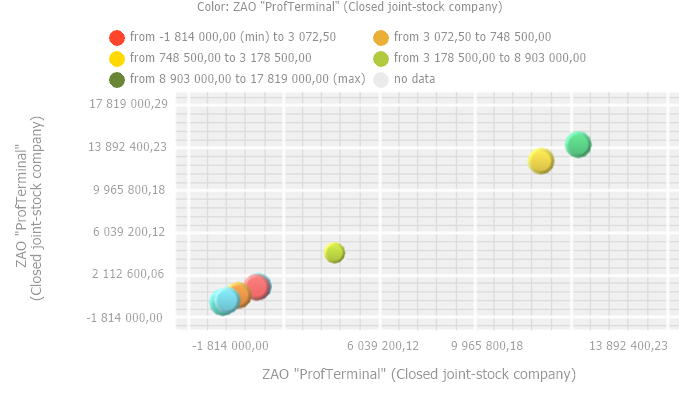
Example of bubble chart:
Use the Format group of tabs on the side panel to determine bubble chart settings:
See also: