Percentage: Number;
The Percentage property determines ratio of Y value of a point in the chart data series to height of Y axis.
Use JSON or the setPercentage method to set the property value, and the getPercentage method to get the property value.
To execute the example, the HTML page must contain the Chart component named chart (see Example of Creating a Stacked Histogram). Link the first point of the chart second series to other points of this series, and then change its state:
// Sets percentage displaying mode for the chart data
function setPercentage() {
        // Get Y axis of the chart
        var axis = chart.getYAxis();
        var axisHeight = Math.abs(axis.getMin()) + axis.getMax();
        // Set minimum and maximum values of the axis
        axis.setMin(0);
        axis.setMax(1);
        for (var i in chart.getSeries()) {
            var serie = chart.getSeries()[i];
            for (var j in serie.getPoints()) {
                var point = serie.getPoints()[j];
                point.setPercentage(point.getY() / axisHeight);
                point.setPercentPart(point.getYBottom() / axisHeight);
            }
        }
    }
    // Set percentage displaying mode for chart data
setPercentage();
// Refresh chart columns after rendering
refreshAfterRender();
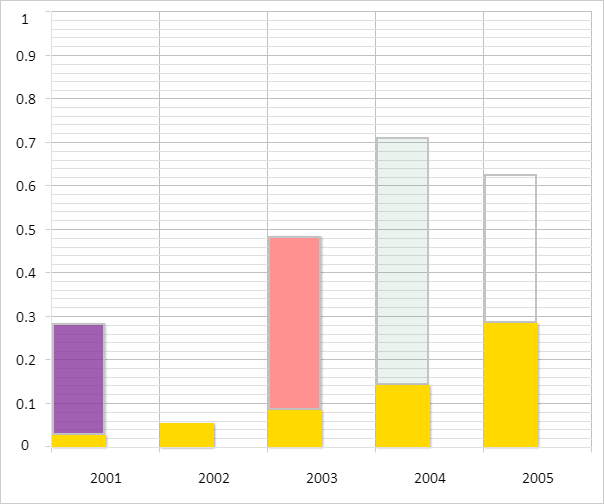
After executing the example percentage displaying mode is set for the chart data:
See also: