redrawHoverPoint(indexes: Array, state: String);
indexes. Array of indexes of the chart data series points.
state. Indicates whether the mouse pointer hovers over the chart data series point. Available values:
Hover. The chart data series is hovered.
Unhover. The chart data series is not hovered (default).
The redrawHoverPoint method redraws points of the chart data series.
Executing the example requires that the HTML page contains the Chart component named chart (see Example of Creating a Line Chart). Resize markers for data series points with the indexes 0, 2 and 4:
// Sets size of data series markers
function setMarkersRadius(serie, radius) {
        // Get settings of the chart data series
        var states = serie.getStates();
        states.Normal.Marker.Radius = radius;
    }
    // Get the first data series
var serie = chart.getSeries()[0];
// Set new radius for markers of the points with the indexes 0, 2 and 4
setMarkersRadius(serie, 25);
// Redraw the data series points
serie.redrawHoverPoint([0, 2, 4], "Hover");
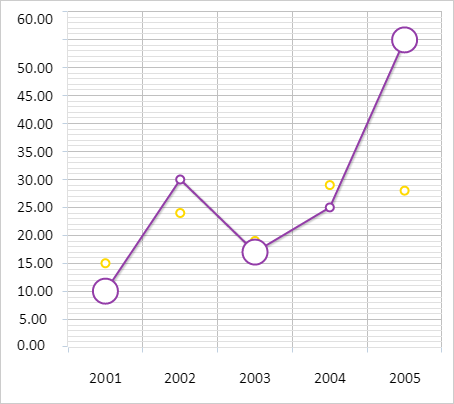
After executing the example size of markers for chart data series points with the indexes 0, 2 and 4 is set to 25 pixels:
See also: