DataLabels: Object;
The DataLabels property determines data label settings for chart data series points.
Use JSON or the setDataLabels method to set the property value, and the getDataLabels method to get the property value.
The object with settings can contain the following fields:
Executing the example requires that the HTML page contains the Chart component named chart (see Example of Creating a Line Chart). Render data labels with points values for the points of the first data series with 0, 2, 4 indexes:
// Get the first data series
var serie = chart.getSerie(0);
for (var i in serie.getPoints()) {
    var point = serie.getPoints()[i];
    point.setDataLabels({
        Enabled: true
    });
    // Get settings of data labels
    var labelsOptions = serie.getDataLabels();
    labelsOptions.Text = point.getY();
    labelsOptions.Parent = serie;
    labelsOptions.Left = point.getPlotX();
    labelsOptions.Top = point.getPlotY();
    var dataLabel = new PP.Ui.ChartText(labelsOptions);
    point.setDataLabel(dataLabel);
};
// Render data labels for time series points
serie.drawDataLabels([0, 2, 4], true);
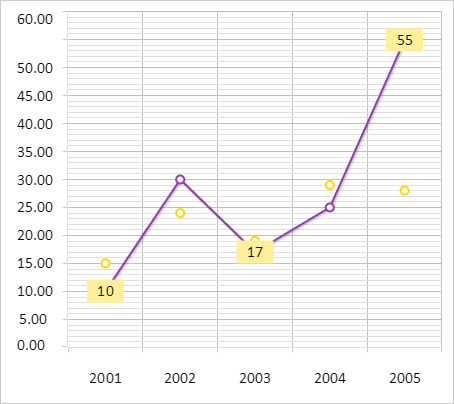
After executing the example data labels with points values were rendered for the first data series with the 0, 2 and 4 indexes:
See also: