BorderPenEnabled: Boolean;
The BorderPenEnabled property determines whether to show borders for items that correspond to points of the chart data series.
Use JSON to set the property value, and the getBorderPenEnabled method to get the property value.
Available values:
true. Border of the items that correspond to points of the chart data series, is shown (default).
false. Border of the items that correspond to points of the chart data series, is not shown.
Executing the example requires that the HTML page contains the Chart component named chart (see Example of Creating a Stacked Histogram). Hide border for columns of the second series in the histogram:
// Get the second data series
var serie = chart.getSeries()[1];
if (serie) {
    PP.Object.defineProps(PP.Ui.ChartCanvasSerie, ["BorderPenEnabled"], true);
    // Disable displaying borders for columns
    serie.setBorderPenEnabled(false);
    // Redraw the histogram
    chart.redraw(true);
};
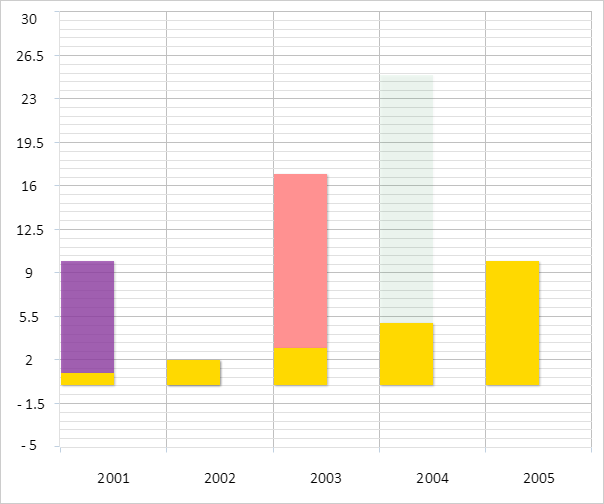
After executing the example border for columns of the second series in the histogram is hidden:
See also: