addPoint(options: Object, redraw: Boolean);
options. JSON object that contains settings of the chart data series.
redraw. Indicates whether the chart is redrawn. Available values:
true. The chart is redrawn.
false. The chart is not redrawn (default).
The addPoint method adds a point to the chart data series.
Executing the example requires that the HTML page contains the Chart component named chart (see Example of Creating a Line Chart). Add a dummy point to the first data series of the chart:
function defineEvents(serie) {
    // Process the PointAdd event
    serie.PointAdd.add(function(sender, args) {
        console.log("Added a point with the value %s", args);
        setMarkersRadius(serie, 15);
        sender.redrawConnectors()
    });
    // Process the RemovePoint event
    serie.RemovePoint.add(function(sender, args) {
        console.log("Removed the point with the value %s", args);
    });
};
// Sets size of data series markers
function setMarkersRadius(serie, radius) {
    // Get settings of the chart data series
    var states = serie.getStates();
    states.Normal.Marker.Radius = radius;
}
// Creates a data series point
function createPoint(serie) {
    // Create a new series point
    var point = {
        Color: "#ff0000",
        Id: "customPoint",
        Name: "custom",
        Parent: serie,
        X: serie.getPoints().length,
        Y: 15,
    };
    // Add this point
    serie.addPoint(point, true);
    serie._pointsToDraw[serie.getPoints().length - 1].setIsFictive(true);
    serie.PointAdd.fire(serie, point.Y);
};
// Remove data series point
function removePoint(index) {
    var points1 = serie.getPoints().length;
    // Get series point
    var removePoint = serie.getPoint(index);
    // Remove series point
    serie.removePoint(serie.getPoints().length - 1, true);
    var points2 = serie.getPoints().length;
    if (points2 < points1) {
        serie.RemovePoint.fire(serie, removePoint.getY());
    }
};
// Get the first data series
var serie = chart.getSeries()[0];
// Determine event
defineEvents(serie);
// Create a point
createPoint(serie);
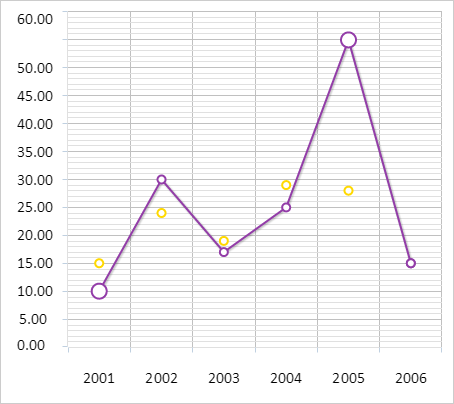
After executing the example a point is added to the first chart data series:
The browser console shows appropriate message:
Added a point with the value 15
Now remove the series point:
removePoint(serie.getPoints().length - 1);
After executing the example the last point in the first data series of the chart is removed. The browser console displays appropriate message:
Removed the point with the value 15
See also: