Application developers can connect custom chart templates. A custom template changes all data series of charts according to the template in the *.svg format. Template file should correspond to certain structure and consist of standard SVG markup and additional attributes of Foresight Analytics Platform.
NOTE. Custom templates can be connected for histograms and pie charts in the tools: Dashboards, Analytical Queries (OLAP) tools only in the web application and in the designer of business applications.
To connect custom chart templates:
Add SVG template files to the folder with installed web application or designer of business applications:
The path to the folder with installed web application:
If plugin description is added in the config.json field:
In Linux OS: /opt/foresight/fp10.x-webserver/r.
In Windows OS: C:\Program Files (x86)\Foresight\Analytics Platform 10.x Web Application\r.
If plugin description is added in the PP.xml tab:
In Linux OS: /opt/foresight/fp10.x-webserver.
In Windows OS: C:\Program Files (x86)\Foresight\Analytics Platform 10.x Web Application.
The path to the folder with installed designer of business applications:
In Linux OS: /opt/foresight/fp10.x-dba.
In Windows OS: C:\Program Files (x86)\Foresight\DBA_10.x. The DBA_10.x folder is created manually and may differ.
TIP. To facilitate the use of templates, create the Plugins folder that will store a plugin for connecting templates. In the Plugins folder create the Templates folder that will store SVG template files.
In Linux OS grant permissions for the custom folder with plugin files in Debian-based distributions for the www-data user. When working in other Linux OS distributions replace www-data with apache for RedHat-based distributions or with apache2 for ALT Linux.
Create the ChartTemplates.js plugin with parameters of used templates and place it in the Plugins folder:
PP.ChartTemplates = function (settings) {
    PP.ChartTemplates.base.constructor.apply(this, arguments);
    this._Interfaces = [];
};
PP.initClass(PP.ChartTemplates, PP.Object, 'PP.ChartTemplates', [PP.IPlugin]);
PP.Object.defineProps(PP.ChartTemplates, ['Interfaces', 'ImagePath'], false);
PP.ChartTemplates.prototype._ImagePath = PP.ImagePath;
PP.ChartTemplates.prototype.getInstance = function () {
    return null;
};
PP.ChartTemplates.init = function (settings) {
    var t = new PP.ChartTemplates(settings);
    var templates = PP.Ui.getConfig().getChart().getTemplates();
    var newTemplates = {
        '<template name>': {

            'Id': '<template unique identifier>',

            'PPType': '<chart type>',

            // The getImagePath method returns the relative path to template files,
            // specified in the value attribute of the <param> section at Step 3. If the template file
            // is contained in a single nested folder, specify it before
            // the <template file name> substitution

            'Source': t.getImagePath() + '<template file name>.svg'

        },
        // Add several templates
        ...
    };
    for (var i = 0, nt; i < templates.length; i++) {
        if (nt = newTemplates[PP.getProperty(templates[i], 'Id')]) {
            templates[i] = nt;
            delete newTemplates[nt.Id];
        }
    }
    for (var c in newTemplates)
        templates.push(newTemplates[c]);
    PP.Ui.getConfig().getChart().setTemplates(templates);
    return t;
};
NOTE. Values specified in the <template name> and <unique template identifier> substitutes can match and correspond to the template file name.
In the <chart type> substitute set one of the values:
PP.Ui.ChartColumnTemplate. When histograms.
PP.Ui.ChartPieTemplate. When pie charts.
Add a plugin description in the configuration file:
In the config.json file of the web application/designer of business applications use the plugins field to describe plugin:
"modules": {
  "8448": {
    "customization": {
      "plugins": [
          {
              "name": "ChartTemplates",
              "path": "./Plugins/ChartTemplates.js",
              "params": [
                {
                  "name": "ImagePath",
                  "value": "./Plugins/Templates/"
                }
              ]
           },
          {
              ...
          }
        ]
     }
  }
}
NOTE. The 8448 value is a numeric value of the Dashboard object class. Set the 2561 class value for the Express Report object.
Restart the back end of web application/designer of business applications tab.
After executing the operations, custom chart templates will be connected in the web application or in the designer of business applications and are available in the drop-down menu of the ![]() Styles button on the Chart ribbon tab.
Styles button on the Chart ribbon tab.
To execute the example, download the Plugins.zip archive with a set of ready-to-use templates and unarchive it to the web application installation folder C:\Program Files (x86)\Foresight\Analytics Platform 10.x Web Application.
Add a plugin description in the PP.xml configuration file in the <plugins> section:
<plugins>
    <plugin name="ChartTemplates" path="../Plugins/ChartTemplates.js" loaded="true">
        <params>
            <param name="ImagePath" value="../Plugins/Templates/"/>
        </params>
    </plugin>
</plugins>
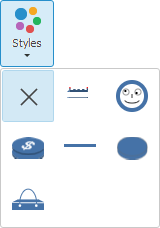
After executing the operations the custom templates are connected in the web application and are available in the drop-down menu of the ![]() Styles button on the Chart ribbon tab:
Styles button on the Chart ribbon tab:
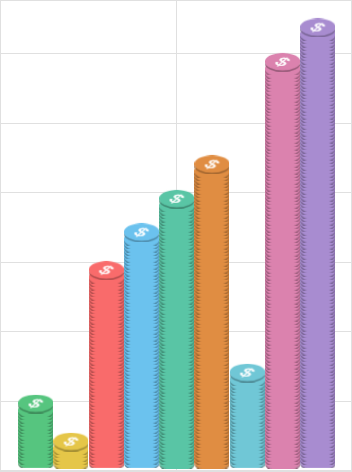
When a custom template is selected, the appearance of chart series is changed, for example:
See also:
Plugins | Chart Types | Custom Chart Template Structure