Chart templates are created in the svg (Scalable Vector Graphics) format and have the following structure:
The <svg> elements inside the <svg> root element are used as template parts in the following order:
Footer. Footer.
Content. Content.
Header. Header.
Other markup inside the <svg> root element is ignored.
If the <svg> root element does not have embedded <svg> elements , it is interpreted as content.
Membership to particular part of the embedded <svg> can be set via the id attribute ("footer" / "content" / "header" respectively).
Foresight Analytics Platform, besides the standard SVG markup, uses special attributes in chart templates.
It is added to the <svg> tag.
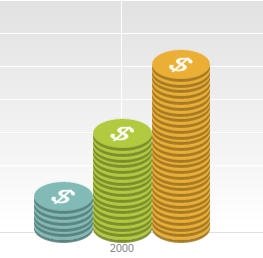
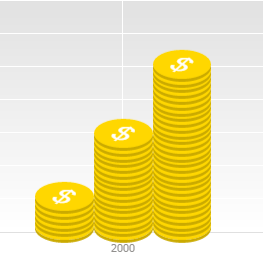
It determines that the shape of this tag must be painted in the series color multiplied for this number.
The example:
ppchart-color-value="1" not specified ppchart-color-value
It is added to the <svg> tag.
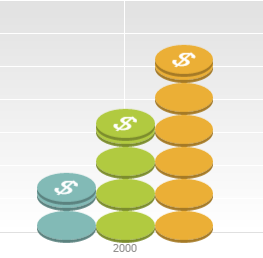
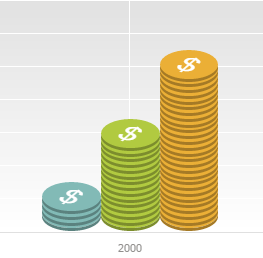
It determines overlapping of element to the lower element for histograms. It is determined as a percentage of its height, or in pixels.
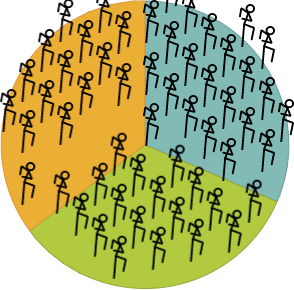
It determines overlapping in both sides for pie charts. It is determined as a percentage of the corresponding side size.
The example:
The attribute is changed for the Content part.
ppchart-overlap="82%" ppchart-overlap="0%"
It is added to the <svg> tag.
It determines offset of the lowest series element by the Y axis for histograms. It is determined as a percentage of element height.
By default, the lower element is set to 100%.
It sets the point that binds content grid to the sector center for pie charts. This point also determines whether the next grid image is contained into the sector. The image center is set by default.
The example:
ppchart-target-y="63%" ppchart-target-y="100%"
The attribute is available only for pie charts and is added to the <svg> root tag.
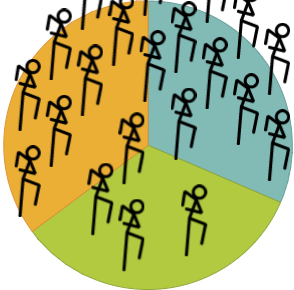
It determines the size of the larger template side relative to the circle radius. The default value is 0.3.
If the value is 0.5, image length is equal to half the circle radius.
The example:
ppchart-size="0.3" ppchart-size="0.5"
The attribute is available only for pie charts and is added to the <svg> root tag.
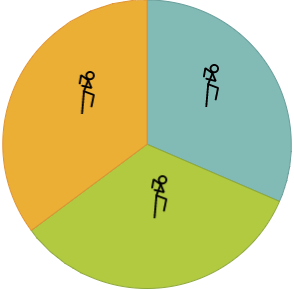
It determines repeated use of template. It contains the "repeat" value by default.
Available values:
none. No template repeating.
repeat-x. It repeats template by the X axis.
repeat-y. It repeats template by the Y axis.
repeat. It repeats template by the X and Y axes.
The example:
ppchart-repeat="repeat" ppchart-repeat="none"
The attribute is available only for pie charts and is added to the <svg> root tag.
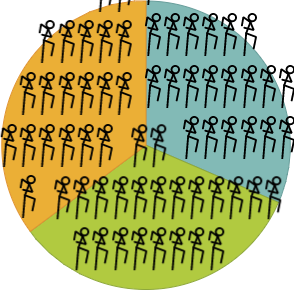
It determines offset of neighbor columns on repeating the template. The default value is 0.
The example:
ppchart-offset-y="0" ppchart-offset-y="50%"
It is added to the <svg> root tag.
It determines minimum size in pixels (for histograms - width, for pie charts - larger template size), at which the template is displayed. If the size is smaller, a standard circle series or sector is displayed. The default value is 5.
The example:
ppchart-min-size="20"
The attribute is available only for pie charts and is added to the <svg> root tag.
It determines, which intersections can be displayed. All intersections are allowed by default.
Available values:
border. Beyond chart borders.
sector. Intersection with the adjacent sector.
template. Intersection with the adjacent sector template.
The example:
ppchart-allowed-intersections="border;sector" ppchart-allowed-intersections="sector"
See also:
Connecting Custom Chart Templates