
 To display the Data Source Structure tab
Tool interfaces in the web application and in the desktop application are identical, and differences in functionality are given in appropriate comments.
Visualizer data source structure setup enables the user to set dimensions available for the user, and set names of attributes displayed in the visualizer.
To set up structure of active visualizer data source, use the Data Source Structure tab in the Structure and Parameters dialog box.
To display the Data Source Structure tab
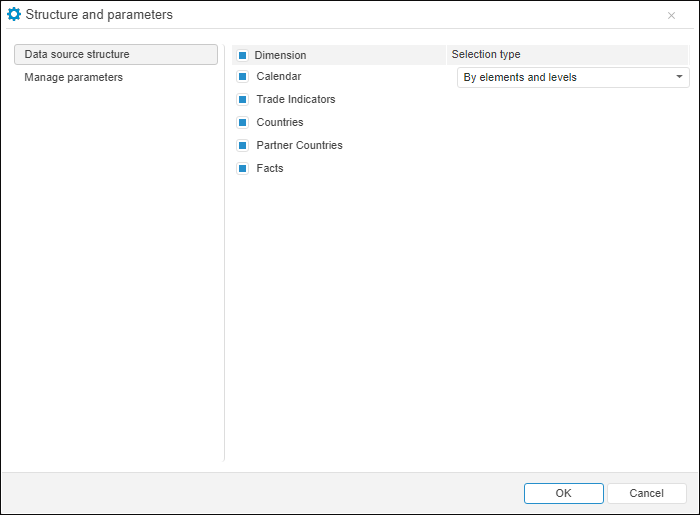
To set up visualizer data source structure:
Use the Dimension column to select checkboxes next to the dimensions, which should be available for user in the Selection group of tabs on the side panel. Detailed description is given in the Showing or Hiding Dimensions in the Selection Tab Group section.
Dimensions, for which alternative hierarchies are set up, are displayed as a tree (it is collapsed by default). In expanded tree dictionaries and dictionaries attributes used as alternative hierarchies are listed. The option is available if data source is:
A standard cube, which dictionaries attributes are used as alternative hierarchy. To use alternative hierarchy based on dictionary attribute, one should execute preparatory settings is used in fixed dimensions.
An ADOMD cube, for dictionaries of which alternative hierarchy. If checkboxes next to alternative hierarchy names are selected, the selected alternative hierarchies are displayed on the side panel on separate tabs.
Use the Selection Type column to set selection mode for calendar dimensions. To do this, select calendar dimension name and choose the selection type in the drop-down list:
By Elements Only. Only calendar elements are displayed on the Selection tab in the side panel.
By Levels Only. Only calendar elements are displayed on the Selection tab in the side panel.
By Elements and Levels. Calendar elements and levels will be displayed on the Selection tab in the side panel.
See also:
Selecting and Setting Up Visualizer Data Source