 Quick setup
The following methods are used to set up general chart parameters:
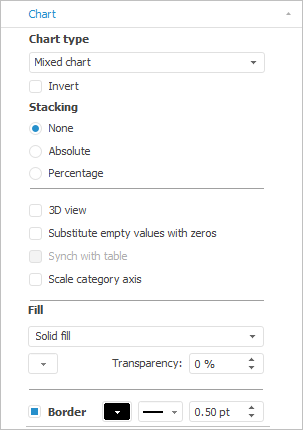
To quickly set up data series format, use the Chart tab of the side panel.
The following chart series settings are available:
Chart type settings.
Border and fill settings and other settings.
The following actions are available on working with charts:
To execute advanced setup of data series format, use the Chart Parameters dialog box.
Depending on the chart type the following actions are available:
The Chart tab is located on the side panel and is used to set up general chart parameters.
Make sure that the side panel is displayed.
Select the chart in the working area.
Select the Format radio button on the side panel and go to the Chart tab.

The following actions are available for all chart types:
Use the ribbon. Click the ![]() Type button on the Chart ribbon tab.
Type button on the Chart ribbon tab.
Use the Chart side panel tab.
Use the Chart Type dialog box.

 Substitute empty values with zeros
To show empty values in the chart as zero values, select the Substitute Empty Values with Zeros checkbox. The checkbox is deselected by default, and empty values are not substituted with zeros, chart area break is displayed.
The left chart shows empty values substituted with zeros, the right chart does not show them:

To set up chart background, specify background fill type in the Fill drop-down list:
None. Chart background fill is not used.
Solid Fill. Select the solid fill color in the drop-down palette. The desktop application enables the user to set up chart background transparency.
Gradient Fill. To set up two-color fill of chart background, specify the start and the end colors of gradient in the drop-down palettes. If required, specify slope angle and transparency percent in the Angle and Transparency boxes.
NOTE. On setting transparency of solid or gradient fill, take into account that 100% corresponds to full transparency (data chart background becomes invisible), 0% corresponds to full opacity.
To show chart border, select the Border checkbox and determine settings of border color and width. The desktop application also enables the user to set up line type for data series border.
Features that are available depending on the chart type:
It is available for series of linear, scatter, mixed charts, histogram and area chart.
Select the Invert checkbox to use the bottom to top scale. If the checkbox is deselected, scale is oriented from left to right.
It is available for series of line, mixed chart, histogram and area chart.
In the Stacking group specify the type of stacking in use by selecting one of the radio buttons:
None. A chart shows absolute values of a series.
Absolute. A chart shows values with stacking allowing to assess part of each value in the total sum.
Percent. A chart shows values as percentage allowing to assess part of each value in the total sum.
It is available for series of line, pie, mixed charts, histogram and area chart.
To show 3D chart, select the 3D View checkbox.
To synchronize chart view with data table, select the Synch with Table checkbox. After selecting the checkbox chart can be scaled.
NOTE. Setup is available only in the desktop application for the Analytical Queries (OLAP), Dashboards tools for line chart, histogram, area chart and mixed chart.
Zoom enables the user to change size of the shown part of the chart with saving of proportions.
To zoom the chart, use the mouse to select the chart part, which is necessary to enlarge. The chart is automatically rebuilt. The plot area will show the part, which was selected. To return the chart to the original view, click the  button in the plot area.
There are limitations on working with synchronization:
The setting is available in the desktop application for series of line, mixed chart, histogram and area chart in 2D mode.
The setting is available if chart or table data views are located vertically or horizontally.
The setting is not available on working with regular report charts.
Zoom enables the user to change size of the shown part of the chart with saving of proportions.
Zoom category axis is used to manage chart area view.
NOTE. The setting is available only in the web application for the line chart, histogram, 3D histogram with groups, area chart, mixed chart and stepped chart.
To start working with category axis zoom, enable scroller. To do this:
Select the Zoom Category Axis checkbox on the Chart tab of the side panel.
Click the ![]() Zoom Category Axis button on the Chart ribbon tab.
Zoom Category Axis button on the Chart ribbon tab.
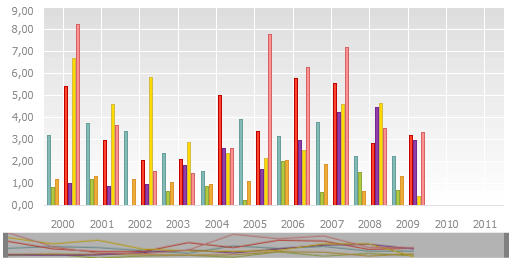
After selecting the checkbox the scroller is shown under the chart area, chart zoom is available:

To zoom, point the cursor to the scroller border. The pointer changes to the two-headed arrow:

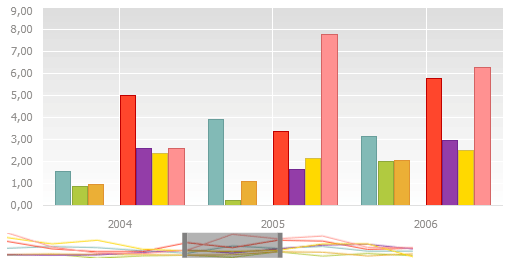
Click the main mouse button and hold down it to move the border. The chart is automatically rebuilt. The chart plot area will show the part corresponding to the scroller part:

To move the scroller, point the mouse pointer to it. The pointer changes to the four-headed arrow:

Click the main mouse button and hold down it to move the scroller part to the required position. The plot area will show the corresponding chart part.
To quick zoom, put the mouse pointer to the scroller or the chart area and scroll up the mouse wheel to zoom in and scroll down to zoom out.
To return the chart to original size:
Deselect the Zoom Category Axis checkbox.
Move scroller borders to initial position.
Scroller view is disabled by default.
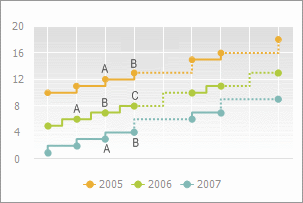
A step is a broken line that connects two neighbor values in the series.
It is available only for a stepped chart.
To change step position relative to data series point, select the required position in the Step drop-down list: left, center or right.
Below is an example of a stepped chart, in which the following is set up: the 2005 series has a step set up to Left position (from point B to point A); the 2006 series has a step set up to Center position (from point B to point A and to point C); the 2007 series has a step set up to Right position (from point A to point B).

NOTE. Step position can also be set up on the Data Series side panel tab.
See also:
Chart Types | Setting Up Chart Components