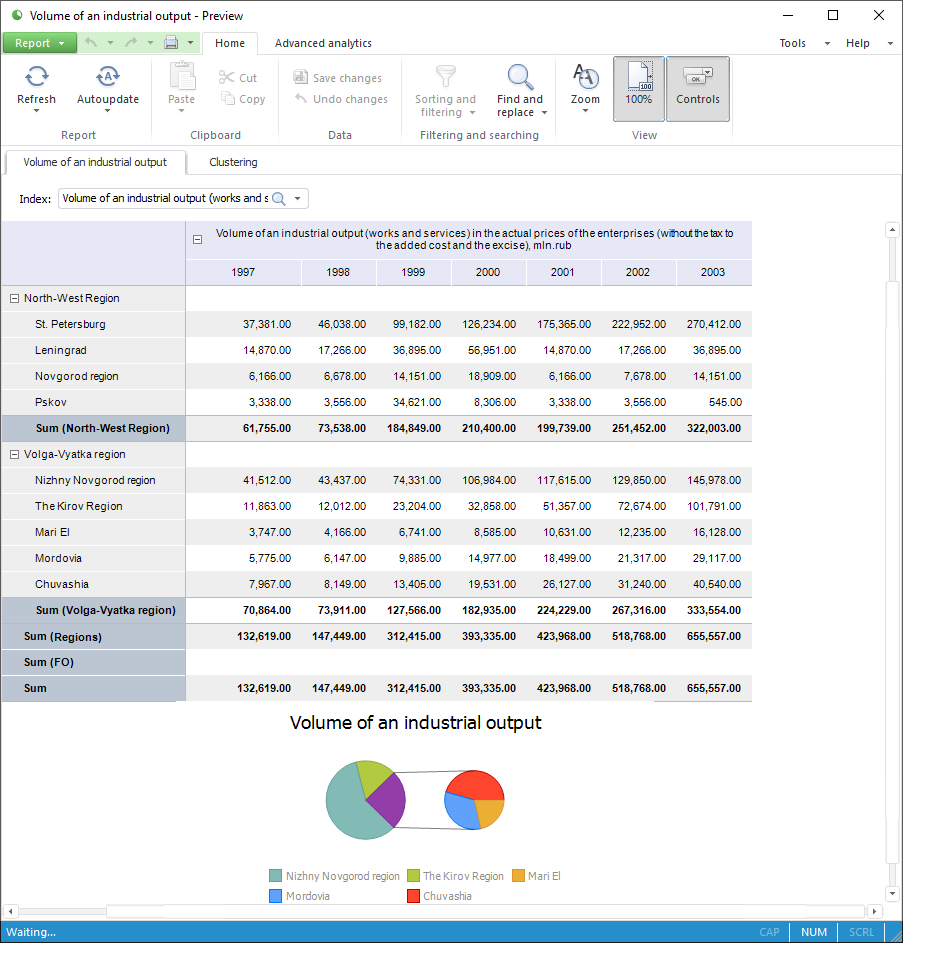
Building Report for Printing
To build a report for printing, use the Reports tool:

The Reports tool is used to create reports with complex formatting that are used for printing.
Key features:
Building reports using table and text sheets.
Editing data and saving changes to the source.
Data visualization on report sheet.
Setting report for print.
Using interactive controls
Supporting relational, as flat tables, and multidimensional, as crosstabs, data views.
Setting up data drill down and drill up, moving from one view to any other, converting from multidimensional to relational data.
Integration of Microsoft Office.
To work with the Reports tool, you will need:
The PP_ReportEditor feature to build and edit regular report.
The PP_ReportViewer feature to provide interactive view of the ready regular report.
Data sources. All cube types, time series databases, modeling variables, data sets, express reports are available as a source. If a required data source is absent in the repository, it can be added by using data import wizard.
To start working, see the Getting Started with the Reports Tool article.
To build reports, see the Building Report article.
To work with ready report, see the Working with Ready Report article.
If you have any questions, see the Questions and Answers article.