Select table visualizer in the working area.
Go to the Designer ribbon tab.
Click the  Visualizer Data button and select visualizer building option:
To display the data in the report, put visualizers on the table sheet:
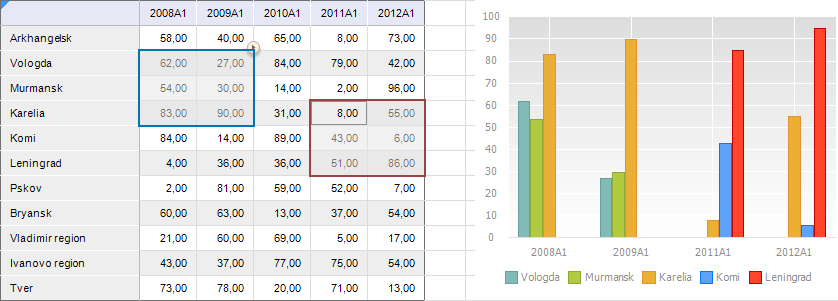
To change data set presented by visualizers, use selection.
The Reports tool enables the user, on selecting a cell range in table visualizer, to rebuild visualizers built on the same slice as the table. Visualizers are charts and maps.
To select a table area, by which visualizers are built:
Select table visualizer in the working area.
Go to the Designer ribbon tab.
Click the  Visualizer Data button and select visualizer building option:
Entire Table. Visualizers are built by the entire table
Selected Area. Visualizers are built by the data selected in the table.
After setup, visualizers are rebuilt according to the set parameters. Visualizers are rebuilt both in the view mode and in the edit mode of regular report.
If data is selected in two or more tables, visualizers are not rebuilt.
If selected data contains working area cells that are not included into the table, visualizers are not rebuilt.
If one cell or corner is selected in the data area table, visualizers are rebuilt by the entire data table.
If several cell ranges are selected in the data area table by means of the CTRL key, visualizers get the joined selection by rows and columns by all selected ranges. For example:

See also: