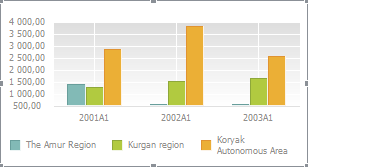
A chart is a means of visual displaying table data of regular report and is used to graphically present data.

A chart retains a connection to data, that is, any change in table data results in redrawing the chart taking into account these changes.
The following operations are available on working with a chart:
Zoom.
Most of chart settings are available in the Format section of the side panel.
To get a full description of chart functions, see the Setting Up Chart Components section.
See also: