To set up zoom mode of chart axes scales, select the Zoom Mode context menu item of activated chart.
NOTE. This context menu item is not available for the Pie, Radar, Scatter and 3D chart.
Select checkbox next to the required zoom mode in the drop-down list:
Only by X Axis. The scale is zoomed only along the X axis.
Only by Y Axis. The scale is zoomed only along the Y axis.
By X and Y Axes. Scales of both X and Y axes are zoomed.
Only by Secondary Y Axis. The scale is zoomed only for secondary Y axis.
By X Axis and Secondary Y Axis. Scales for secondary Y axis and X axis are zoomed.
By Y Axis and Secondary Y Axis. Scales for secondary Y axis and H axis are zoomed.
By All Axes. Scales for all axes are zoomed.
If the checkbox is deselected, the scale is not zoomed.
To constantly show scrollbars in the chart in the zoom mode, select the Show Scrollbars checkbox in the Zoom Mode drop-down list. If the checkbox is deselected, scrollbars are shown only on mouse over. Horizontal scrollbar looks as follows:
![]()
After selecting a zoom mode, select a chart section to zoom with the mouse. The chart is automatically rebuilt. Use scrollbars to view the chart along the axes.
To restore the original look of the chart, click the ![]() button on the scrollbar as many times as necessary.
button on the scrollbar as many times as necessary.
Create a chart for the following data (the series are shown in rows):

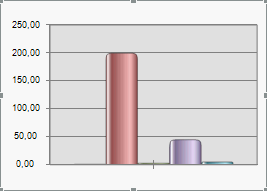
The chart looks as follows:

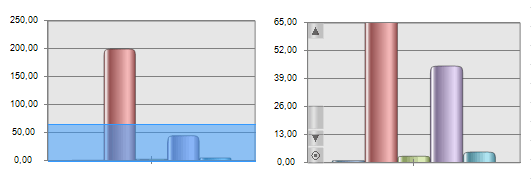
Activate the chart and select the Only by Y Axis and Show Scrollbars checkboxes in the Zoom context menu. Then select the range to zoom. The figure below shows the selected range (left) and the zoomed range (right):

Use the scrollbar to view the entire chart.
See also: