 To display the tab
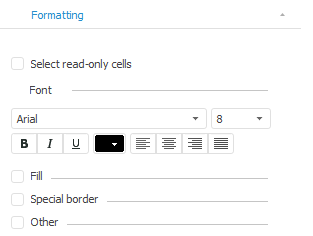
To set table formatting, go to the Formatting tab on the side panel.
Select the table element, for which conditional formatting must be set up.
Go to the Table tab on the side panel.
NOTE. On selecting a table element the group of tabs in the side panel is renamed according to the selected element:
■ If corner is selected - Corner.
■ If heading or sidehead are selected - Format.
■ If data is selected - Table.
■ If totals are selected - Totals.
■ If all data cells are selected - Data.
Go to the Formatting tab.
NOTE. On selecting a table element the tab is renamed according to the selected element:
■ If corner or data is selected - Formatting.
■ If heading, sidehead or totals are selected - Header Formatting and Data Formatting.

Depending on the selected table element, the following formatting settings are available:
To set up corner contents, use the Show Names group of settings:
Select the Show Names checkbox.
Select the radio button that determines the name source:
Table heading.
Table sidehead.
Set name type:
Dimension. Dimension name is displayed.
Attribute. Dimension attribute name is displayed.
Dimension. Attribute. Dimension and attribute names are displayed.
To set up special format of data displayed in the table heading or sidehead, use the Special Format group of settings on the Data Formatting side panel tab:
Select the Special Format checkbox.
Select the required format in the drop-down list:
General.
Number.
Currency.
Date.
Time.
Percentage.
Exponential.
Text.
Additional.
Custom.
A detailed description of special format setup is given in the Setting Up Data Format section.
TIP. To quickly set up table data format, use the Number Format group on the Table ribbon tab.
To change font settings:
Select the Special Font checkbox.
Determine font settings:
Font type. Select the font available in the operating system in the drop-down list. Default font is Arial.
Size. Enter a font size or choose one in the value editor. If the font is changed, table cells are automatically resized.
Color. Choose font color in the drop-down palette.
Font style. Select font style in the drop-down list:
Normal.
Italic.
Bold.
Bold italic.
Alignment. Select the alignment option for table cells contents in the drop-down list:
By value.
Left.
Center.
Right.
Justified.
To set up table cell fill:
Select the Fill checkbox.
Select the radio button next to the required fill type:
Single Color. Select the fill color in the drop-down palette.
Overflow. After selecting the radio button set the parameters:
Tilt. Select the tilt value in the value editor or enter gradient tilt angle.
Set start and end colors of the gradient in the color palettes.
Texture. Image is used as a table cell fill. To select an image, click the ![]() button. In the dialog box that opens select an image in the format: *.bmp, *.dib, *.rle, *.bmz, *.jpg, *.jpeg, *.jfif, *.jpe, *.gif, *.png, *.emf, *.wmf.
button. In the dialog box that opens select an image in the format: *.bmp, *.dib, *.rle, *.bmz, *.jpg, *.jpeg, *.jfif, *.jpe, *.gif, *.png, *.emf, *.wmf.
To set up borders of the selected table element:
Select the Display Borders checkbox.
Select the checkboxes next to the border types, which are required to display:
Top.
Left.
Right.
Bottom.
Horizontal grid.
Vertical grid.
Right diagonal.
Left diagonal.
Set border formatting. Select one or several borders and determine their settings:
Line. Select line type in the drop-down list.
Color. Select the color of line in the drop-down palette.
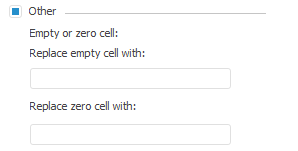
Empty cells or zero cells can be filled with custom contents.
Select the Other checkbox.
NOTE. The checkbox is not available if a corner or headers of totals are selected in the table.
Enter text, number or characters, which will be displayed in empty or zero cells in the appropriate boxes:

The values for filling empty cells, including number ones, are saved in the source. Empty cells are not considered on executing transformation, data ranking, distribution or calculation of totals. Values of zero cells with replaced contents are considered as 0.
To set formatting of several table elements, applied only on executing particular conditions, use conditional formatting.
The express report opened in Microsoft Excel displays expanders if they were set up in the data source of the current report in the desktop application of Foresight Analytics Platform.
See also: