To execute the example, create an HTML page and execute the following operations:
1. In the HEAD tag add links to the following CSS files: PP.css, PP.Express.css.
Also, add links to the following JS files: PP.js, PP.Metabase.js, PP.Express.js and resources.ru.js.
2. In the SCRIPT tag add code that creates the EaxRibbon and EaxDataBox components:
    var eaxData;
    var idTime;
    onReady = function () {
        var IMAGE_PATH = "../build/img/";//path to images folder
        PP.resourceManager.setRootResourcesFolder("../resources/");//path to resources folder
        PP.setCurrentCulture(PP.Cultures.ru);//select language settings
        var eaxAnalyzer, eaxMbService;
        //create the Waiter component for connecting to metabase
        waiter = new PP.Ui.Waiter();
        //Create a metabase instance
        metabase = new PP.Mb.Metabase({
            Id: "PPRepository",
            UserCreds: { UserName: "user", Password: "password" },
            StartRequest: function () {
                waiter.show();
            },
            EndRequest: function () {
                waiter.hide();
            },
            Error: function (sender, args) {
                alert(args.ResponseText);
            }
        });
        //Open metabase
        metabase.open();
        //Create a service for working with express reports
        eaxMbService = new PP.Exp.EaxMdService({ Metabase: metabase });
        //open express report with the 935529 key for edit
        eaxAnalyzer = eaxMbService.edit(935529);
        //create a data area
       eaxData = new PP.Exp.Ui.EaxDataBox({
            ParentNode: "Eax",
            Source: eaxAnalyzer, //data source
            Service: eaxMbService, //service, via which data source is opened
            Width: "100%",
            Height: "100%",
            ImagePath: IMAGE_PATH,
            DataChanged: function (sender, args) {
                eaxData.refresh(args);
                rb.refresh(args);
            }
        });
        //create a ribbon
        rb = new PP.Exp.Ui.EaxRibbon({
            ParentNode: "Ribbon",
            Source: eaxAnalyzer,
            Service: eaxMbService,
            ImagePath: IMAGE_PATH,
            ChartDataView: eaxData.getChartView(),//Specify map and chart views for work of settings on ribbon
            MapDataView: eaxData.getMapView(),
            DataChanged: function (sender, args) {
                eaxData.refresh(args);
            }
        });
        window.onresize();
    }
    // Function for resizing the EaxDataBox container on page resize
    window.onresize = function ()
    {
        if (idTime)
            clearTimeout(idTime);
        idTime = setTimeout(function () {
            if (eaxData)
                eaxData.setSize(document.body.offsetWidth, document.body.offsetHeight - rb.getHeight());

            idTime = null;
        }, 100);
    };
3. Within the BODY tag place the created components and specify function to be executed on page loading:
<body onselectstart="return false" class="PPNoSelect" onload="onReady()">
<div id="Ribbon" style="width: 100%;">
</div>
<div id="Eax">
</div>
</body>
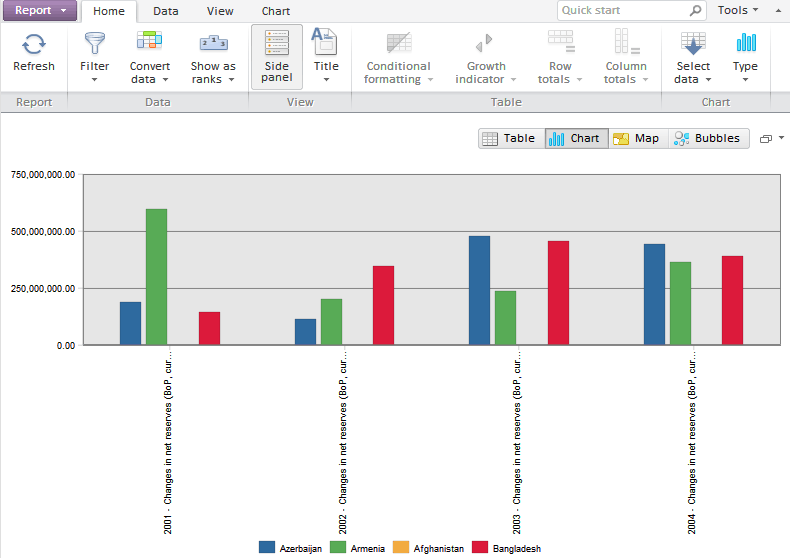
After executing the example the page will contain the EaxRibbon and EaxDataBox components:

On changing chart, map, table or bubble chart settings from the tool ribbon, the selected settings are applied to chart. Sizes of the components will change on browser window resizing.
See also: