The editing by points and by drawing is added for the HighCharts charts.
Use the editmode item attributes to set up edit modes.
The State attribute is relevant if:
Selection disabled (allowSelect: false).
Chart zoom is disabled (zoomType: 'none').
To execute the example, create a chart as shown on the The Highcharts Chart Allocation on HTML Page page. Add the Editmode item to the JSON settings:
editMode: {
state: true,
mode: 'point'
}
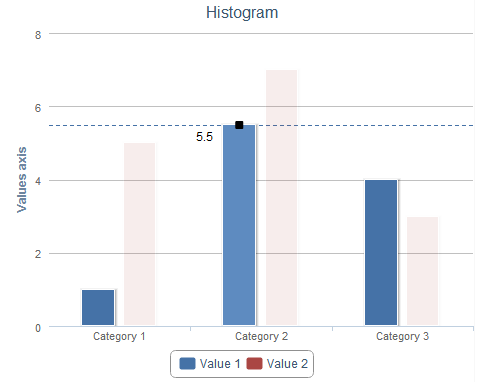
After executing the example points of the selected series of the chart are selected. Mouse cursor changes to a double arrow, when placed over a series point, click the left mouse button, and move the point to its new position while holding down the mouse button. A new value is displayed near the point when dragging it:

To execute the example, create a chart as shown on the The Highcharts Chart Allocation on HTML Page page. Add the Editmode item to the JSON settings:
editMode: {
state: true,
mode: 'draw'
}
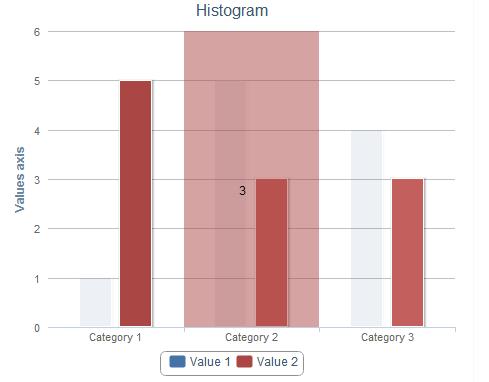
After executing the example editing by drawing is available for the created chart. To edit series values, select this series in the legend. The points of the chosen series are selected in the chart, if you move the cursor over the chart, areas of each series point are darkened. When the mouse cursor move over the chart, the areas for each series point become darker. To change the point value, hold the left mouse button and move the cursor vertically. Holding the button, you can continue editing the neighbor points:

NOTE. When keeping the left mouse button pressed, press the right button to undo changes when editing.
See also: