To allocate the Highcharts chart on the HTML page follow the further steps:
1 In the head tag add links to the following libraries: PP.js, jquery.js and highcharts.src.js:
<head>
<script type="text/javascript" src="../../build/PP.js"></script>
<script type="text/javascript" src="../../libs/jquery.js"></script>
<script type="text/javascript" src="../../libs/hc/highcharts.src.js"></script>
</head>
2 In the script tag add the Java Script code to initialize chart:
<script type="text/javascript">
$(function () {
chart1 = new Highcharts.Chart({
chart: {
renderTo: 'container',
defaultSeriesType: 'column'
},
title: {
text: Column chart
},
xAxis: {
categories: ['Category 1', 'Category 2', 'Category 3']
},
yAxis: {
title: {
text: Value axis
}
},
series: [{
name: Value 1,
data: [1, 5, 4]
}, {
name: Value 2,
data: [5, 7, 3]
}]
});
});
</script>
The chart settings in the example above are specified on the HTML page. The same settings can be set in the separate *.js file for, example, options.js. In this case it is required to add a reference to the options.js file in the HEAD tag. The options.js file must contain the following code:
var options = {
chart: {
renderTo: 'container',
defaultSeriesType: 'column'
},
title: {
text: Column chart
},
xAxis: {
categories: ['Category 1', 'Category 2', 'Category 3']
},
yAxis: {
title: {
text: Value axis
}
},
series: [{
name: Value 1,
data: [1, 5, 4]
}, {
name: Value 2,
data: [5, 7, 3]
}]
}
NOTE. Another example of the file that contains chart settings is given on the Example of the File that Contains HighCharts Settings page.
The following JavaScript code is located on the HTML page:
<script type="text/javascript">
$(function () {
chart1 = new Highcharts.Chart(options);
});
</script>
3 In the body tag add the div item with the "container" identifier which is the container for the chart:
<body>
<div id="container">
</div>
</body>
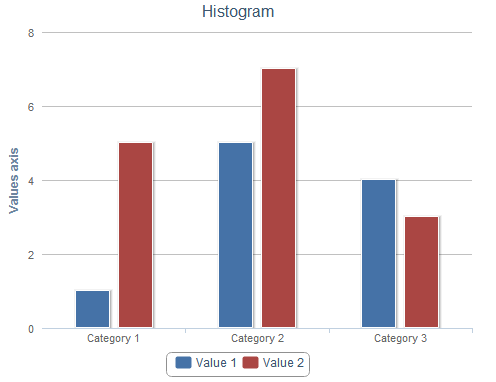
The chart of the following view is located on the HTML page after performing the steps described above:

See also: