Points selection is added for the HighCharts charts.
The allowSelect attribute of the chart element is used to enable points selection.
The allowSelect attribute is relevant if:
Editing is disabled (state: false ).
Chart zoom is disabled (zoomType: 'none').
To execute the example, connect the jquery.js and highcharts.src.js libraries. Below is a JavaScript code to allocate a line chart with the points selection ability on the HTML page:
$(function () {
chart1 = new Highcharts.Chart({
chart: {
renderTo: 'container',
defaultSeriesType: 'line',
allowSelect: true,
zoomType: 'none',
useSelectOnRightClick: true //selection with the right mouse button is allowed
},
editmode: {
state: false
},
xAxis: {
"categories": ['1', '2', '3','4','5']
},
series: [{
name: 'A',
data: [1, 5, 4, 3, 5],
allowedit: true
}, {
name: 'B',
data: [5, 7, 3, 2, 6]
}]
});
});
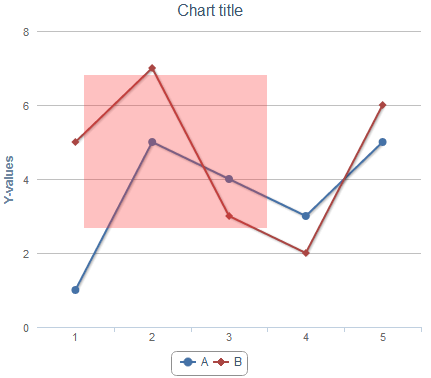
After executing the example a line chart is placed on the HTML page. Select the chart area while holding down the left or right mouse button. The selected area is highlighted:

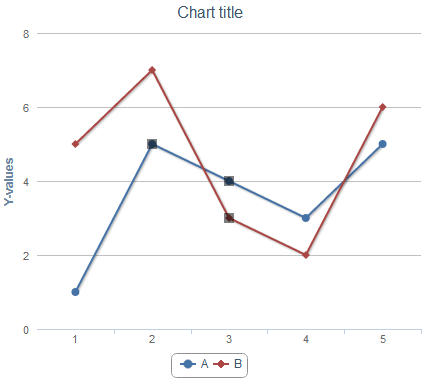
Release the left mouse button. The area highlight is off, but the area points is highlighted:

Use the chart.selection property to return the selected points array.
See also:
HighCharts Improvements | Examples | The HighCharts Chart Allocation on HTML Page | chart Element