setAreaFill(value: Array);
value. The PP.Ui.ChartAreaFill and/or PP.Ui.ChartSectorFill class element array.
The setAreaFill method adds fill elements of bubble chart plotting area.
To execute this example, the HTML page must contain the BubbleChart component named bubbleChart (see Example of Creating the BubbleChart Component). Create fill area on bubble chart:
// Get chart area
chartArea = bubbleChart.getChartArea();

// Set rectangle fill area
areaFillSettings = {
  "Label": {
    "Padding": "5,5,5,5",
    "HorizontalAlignment": "Left",
    "VerticalAlignment": "Top",
    "MaskText": "Some area\nX: from {%Left} to {%Right}\nY: from {%Top} to {%Bottom}",
    "Style": {
      "Release": {
        "Font": {
          "Color": "#008800"
        }
      }
    }
  },
  "Left": "10000",
  "Top": "50",
  "Width": "100000",
  "Height": "50",
  "Fill": {
    "Color": "#008800",
    "Opacity": "0.2"
  },
  "Stroke": "#008800",
  "PPType": "PP.Ui.ChartAreaFill"
};

// Set angle fill area
angleFillSettings = {
  "Label": {
    "Padding": "5,5,5,5",
    "MaskText": "Another area\nFrom {%Start}deg to {%End}deg",
    "Style": {
      "Release": {
        "Font": {
          "Color": "#000088"
        }
      }
    }
  },
  "Start": "0",
  "Angle": "60",
  "Fill": {
    "Color": "#000088",
    "Opacity": "0.2"
  }
};

// Apply fill settings
chartArea.setAreaFill(areaFillSettings);
chartArea.setAreaFill(angleFillSettings);
// Refresh component
bubbleChart.refreshAll();
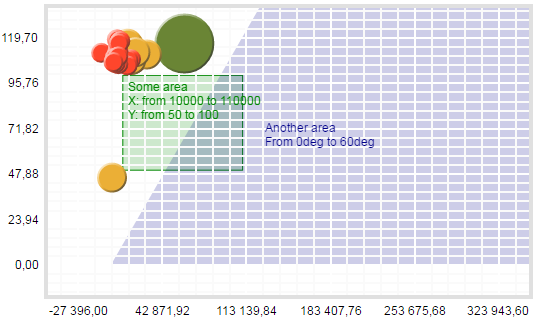
As a result rectangular and angle areas of bubble chart are filled:
See also: