TIP. To quickly set up series format, use the Data Series tab of the side panel.
A marker is a shape that displays separate series points on a chart. Markers that correspond to the same data series, have identical formatting settings.
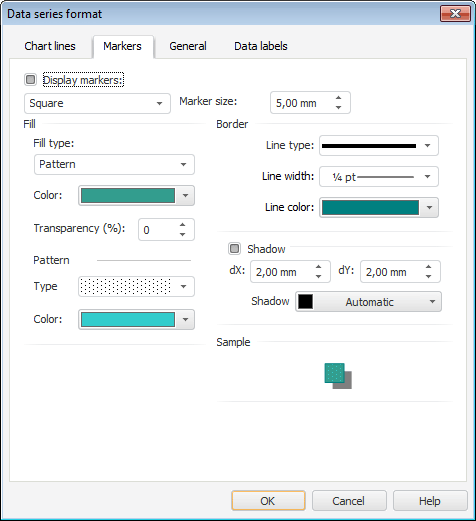
To set up markers, go to the Markers tab of the Data Series Format dialog box.
The setting is available only for linear, scatter, radar and stepped charts, and the Line series type in the mixed chart.
NOTE. Markers can be set up using the Data Series Format dialog box only in the desktop application.
TIP. To quickly set up series format, use the Data Series tab of the side panel.

Set the following data marker settings:
After the settings are determined, the Sample area shows a marker formatted in accordance with the parameters determined on the tab. Check if the marker appearance corresponds to the expected result.
See below examples of markers. On the left chart, the data series markers are hidden, on the right chart, the data series markers are set up as follows:
The Circle marker type is set for markers of the 2001 series, marker fill and marker shadow are set (values of dX and dY offsets are set to 1.00 mm and 0.50 mm respectively).
The Triangle marker type is set for markers of the 2002 series, marker border is set, and marker size is changed.

See also:
Data Series | Setting Up General Chart Parameters | Setting Up Chart Components