A trend line is used to graphically display data trends and predict their future changes. A trend line can be extended beyond the actual data to predict previous and future values.
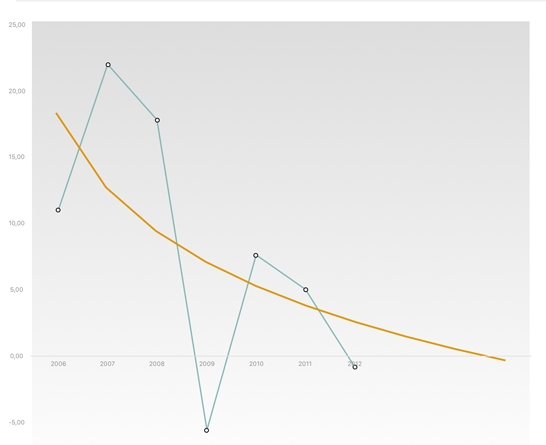
See below an example of a trend line created with the forecast for three points forward:

To display a trend line:
Tap the  button at the top right corner of the page.
Select the Data Series item in the Chart dialog box that opens.
Select the data series, for which a trend line is plotted, in the list.
Enable the Trend Line switch button. Trend line settings are displayed:

To set up a trend line, use the settings:
Type. Select trend line type in the list:
Linear. It is applied in the most simple cases when data series points are located near the line. The linear trend line type is applied for the value that increases or decreases with constant speed. This type is used by default.
Logarithmic. Logarithmic trend line is efficient to describe the value that rapidly increases or decreases at the beginning and then gradually stabilizes. A logarithmic trend line can be used for both negative and positive data values.
Exponential. Exponential trend line is a curved line that should be used if data change speed constantly increases. However, for the data that contains zero or negative values, this trend line type cannot be used.
Power. Power trend line is efficient if the data dependency constantly increases. The example of such dependency may be race car acceleration at each time interval equal to one second. If the data contains zero or negative values, power trend line cannot be used.
Mean. Trend line passes through data series mean value. Such trend line enables the user to view dynamics of changing the considered value depending on the mean value.
Peak Values. The trend lines are plotted: the one that passes through data series maximum value and the one that passes through the data series minimum value.
If this type is selected, it is required to set peak intervals. Use the value editor or manually set the interval, at which series peak values are calculated:
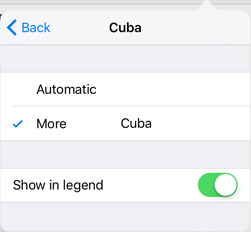
Name. Determine trend line name options:

Automatic. By default, the name is displayed for a tend line that is created as follows: Trend line (series name). For example: Trend line (Bryansk region). The setting is used by default.
More. If the setting is selected, the part of the legend name corresponding to the trend can be changed. The random text can be entered that can be used as a series name.
Show in Legend. The switch button determines whether trend line name is shown in the legend. By default, trend line name is shown in the legend.
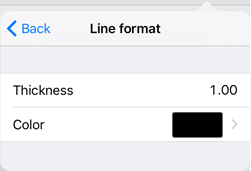
Line Format. Determine trend line format options:

Line Thickness. Set trend line thickness using the editor. The 1 pixel thickness is used by default.
Color. Select color from the palette. The black color is used by default.
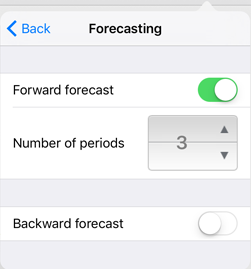
Forecasting. Set forward and backward forecasting options:

Forward Forecast. The switch determines whether trend line is extended beyond the actual data limits to forecast future values.
Backward Forecast. The switch determines whether trend line is extended beyond the actual data limits to forecast previous values.
To enable forecasting, enable the switch and set the number of forecasting periods in the box.
NOTE. Forecasting options are not available for the Mean and Peak Values trend types.
See also: