Tap the  button. The Chart dialog box opens.
Select the Y Axis item.
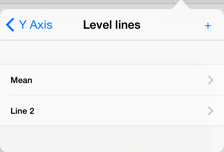
Select the Level Lines item in the dialog box that opens:
A level line is a line, in each point of which the measured quantity has the same value. The line is parallel to the X axis.
To set up level line parameters:
Tap the  button. The Chart dialog box opens.
Select the Y Axis item.
Select the Level Lines item in the dialog box that opens:

To add a level line, tap the  button.
To delete a level line, swipe from right to left along the level line name and tap the Delete button.
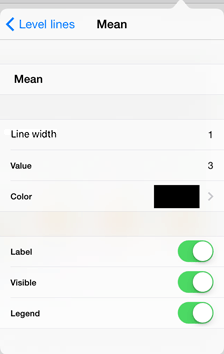
Select a level line in the list. Specify level line parameters in the dialog box:

The level line parameters:
Name in Legend. Specify level line name. To enter name, touch the default name, and then start typing the text.
Line Width. Specify level line width. If line width is 0, the line is not displayed.
Value. Specify the value of the Y axis, at which the level line should be displayed.
Color. Select the color, which should be used for the level line.
Label. Specify whether to show the level line label on the Y axis.
Visible. Specify whether to show the level line on a chart.
Legend. Specify whether to show the element corresponding to the level line in the legend.
To manage visibility of level line elements, use the following switch buttons:
 . The element is visible.
 . The element is invisible.
See also: