
 To display the tab
To set up chart bubble size scale, go to the Size side panel tab.
NOTE. On setting up the scale take into account the following feature: border values are always included into the smaller interval of the scale. For example, there is a scale with three intervals: less than 25, from 25 to 50, greater than 50. The 25 value will be included in the less than 25 interval, and the 50 value will be included in the from 25 to 50 interval.
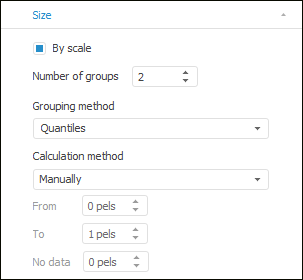
To determine user settings of size scale, select the By Scale checkbox. After the checkbox is selected, determine the settings:
See also: